Example Scenario: During a pharmacy budget review, IV doxycycline was identified as a large, potentially modifiable expense. IV doxycycline costs considerably more than its oral (PO) counterpart (~$30/day vs. <$1/day). The hospital pharmacy leadership requested that the antibiotic stewardship program track and report IV and PO doxycycline and identify opportunities to optimize the IV to PO conversion. The hospital pharmacy has a Pharmacy & Therapeutics approved IV to PO conversion protocol that includes doxycycline.
Background: The NHSN AU Option Line List provides each antimicrobial agent as total days of therapy (DOT) and is stratified by route of administration (IV, intramuscular, digestive (i.e., PO) and respiratory). Stewards can export total doxycycline days of therapy stratified by IV and PO route to an external spreadsheet program (such as Excel™) and create reports for tracking IV and PO administration of doxycycline.
This approach can be applied to other tracking and reporting scenarios where route of administration is of interest (such as the respiratory route for inhalational antimicrobials).
Manipulations of NHSN Extracts
Data Visualizations Using NHSN AU Option for Days of Therapy by Route of Administration At the Facility-level
Figure 1. Quarterly doxycycline DOT stratified by route
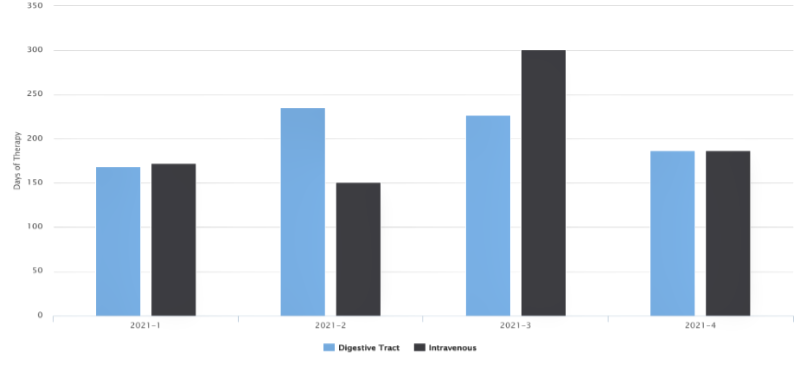
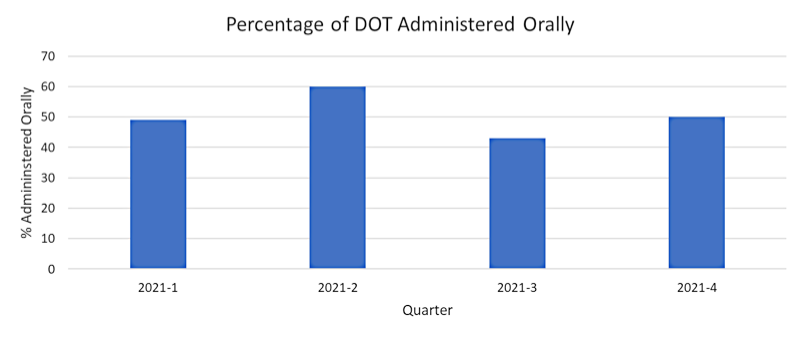
Figure 2. Percentage of Doxycycline Days of Therapy (DOT) Given Orally by Quarter (2021)
[Data Obtained From: NHSN-Analysis-Reports-Antimicrobial Use and Resistance Module- Antimicrobial Use Data-Line Listing-All Submitted AU Data for FACWIDEIN (modified per instructions in the metric guide: Antimicrobial use by route of delivery.]
What you will need for creating data visualization for Figure 1 & 2:
- Export of NHSN AU data from the NHSN Analysis tab.
- Access to Excel™ or other spreadsheet software.
The data extracted from the NHSN Analysis Tab using the “Line listing-All submitted AU data for FACWIDEIN” for the specified time period can be exported to Excel™ and stratified by agent and route to create figure 1. This report can also be modified in NHSN to export data on doxycycline only. The same export can be used to represent the DOT as the percentage of total seen in figure 2.
More detailed instructions on how to export NHSN data, manipulate the data in Excel™ and create the associated figures can be found in the DASON’s metric guide: Antimicrobial use by route of delivery.
Considerations for Interpretation: Antimicrobial Use data are reported into NHSN as monthly aggregate DOT, not individual administrations. As such, the calculated sum of IV and PO DOT may exceed the aggregated total DOT reported for the same time period. This may occur during IV to PO switch when a patient is administered doses of the same antimicrobial via multiple routes on the same day (e.g., IV in the morning and PO in the evening). The switch day would contribute equally to IV and PO DOT (Figure 1) and lead to a larger calculated total compared to aggregated total DOT. This should be taken into consideration when interpreting the data. The percentage of oral DOT over calculated total DOT (Figure 2) may be an easier way to use the data when sharing with the stewardship team or with frontline providers.
Data Visualizations using NHSN AU Option for Days of Therapy by Route of Administration at the Unit Level
Antimicrobial use data can also be exported from NHSN by hospital unit.
Figure 3. Doxycycline Use by Route Stratified by Hospital Unit (2021)
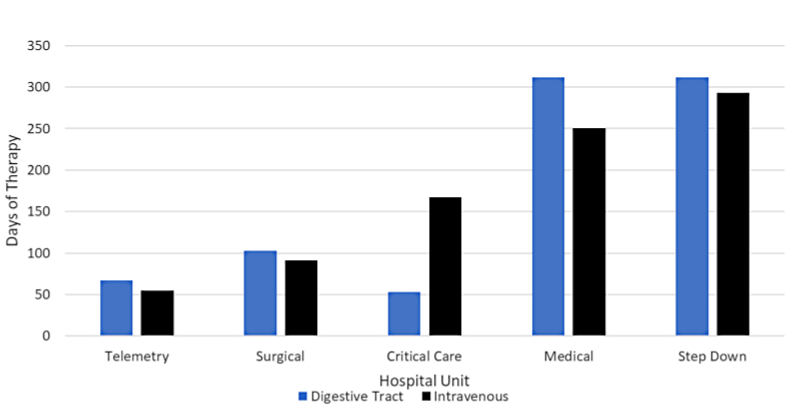
[Data Obtained From: NHSN-Analysis-Reports-Antimicrobial Use and Resistance Module- Antimicrobial Use Data-Line Listing-All Submitted AU Data by Location (modified per instructions in the metric guide: Antimicrobial use by route of delivery.]
What you will need for data visualization for Figure 3:
- Export of NHSN AU data for the time period of interest from the Analysis tab in NHSN (use the line listing for all submitted AU data by location).
- Access to Excel™ or other spreadsheet software.
Instructions on how to do this also appear in the DASON’s metric guide: Antimicrobial use by route of delivery
Metrics Using Local Data Sources (Augmented Data)
Data Visualizations Using Augmented Data for Provider-Selected Clinical Indication and Route of Administration
Local data sources, such as clinical indication, can be used to augment NHSN AU data to inform potential stewardship interventions.
Figure 4. Doxycycline Use by Provider-Selected Clinical Indication and Route of Administration (2021)
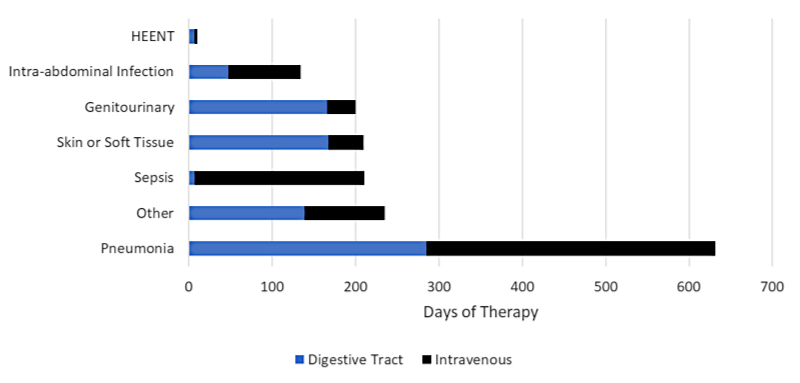
[Data Obtained From: Local Data Extracts- see sample template for this data. – Further instructions on how to manipulate these data using the metric guide: Agent Use by Indication.]
What you will need for this data visualization for Figure 4:
- Clinical indication for antimicrobial orders which may be entered by prescribers at the time of order entry at your facility.
- Access to local antimicrobial prescribing data that includes administrations by route of administration that either includes the clinical indications provided at the time of order entry, or with an identifier that can link administrations to antimicrobial orders.
- Access to Excel™ or other spreadsheet software.
Considerations for Interpretation: Calculating DOT by specific indications for use where rates of IV are high may help inform targeted stewardship interventions to decrease IV use.
Data Visualizations using Augmented Data by Prescriber and Route of Administration
Stratifying DOTs by prescriber using augmented data can help inform audit and feedback stewardship interventions.
Figure 5. Oral and Intravenous Doxycycline Days of Therapy by Prescriber (2021)
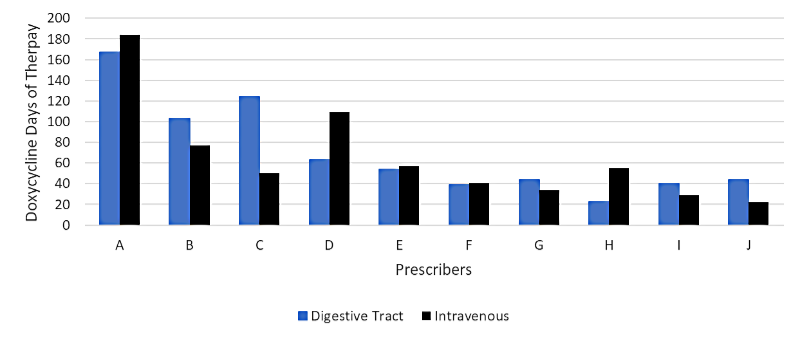
[Data Obtained From: Local Data Extracts- key considerations are discussed in this metric guide: Antibiotic Use by Prescriber in Days of Therapy. – Further instructions on how to manipulate these data using the metric guide: Provider Specific Prescribing Stratified by Route or Indication]
What you will need for this data visualization for Figure 5:
- Access to local antimicrobial prescribing data that includes administrations by route of administration that includes the name of the prescriber at the time of order entry.
- Access to Excel™ or other spreadsheet software.
AU data by prescriber are reported as raw DOT. Further information on various aspects of using prescriber data can be found in the DASON's metric guide Provider Specific Prescribing Stratified by Route or Indication.
Considerations for Interpretation: It is worth further investigating the outliers (prescriber D and H). These may be prescribers who have important reasons for prescribing in an individual setting (such as the ICU) or may be outliers in their group (different patterns than other hospitalists for example).
Menu of Stewardship Interventions:
To address the high rate of IV doxycycline, there are several potential targets for stewardship intervention:
- Review the IV to PO conversion protocol:
- Does the IV to PO conversion protocol exist in the policy manual?
- Does the current policy include doxycycline as part of the protocol?
- Are the inclusion/exclusion criteria in the protocol too strict, preventing appropriate changes?
- What is the timing of the switch in the protocol? Earlier IV to PO switches could lead to more oral agent use.
- Review IV to PO protocol compliance.
- Review cases of IV doxycycline and/or IV to PO conversion to see how often the protocol was followed and to see if there are common reasons why it might not have been followed.
- Identify who is implementing the IV to PO switch protocol.
- Is this group aware that doxycycline is included in the protocol?
- If using an electronic task list in the electronic health record, is doxycycline included in the work list?
- Does this work sometimes get triaged due to other higher-acuity tasks?
- Make sure that PO doxycycline is an option on order sets when appropriate. Also, consider adding durations for doxycycline to order sets.
- Engage nursing staff in encouraging IV to PO switches in patients who are tolerating oral therapy.
Resources:
https://www.idstewardship.com/resource-help-changing-iv-po-antibiotics/
Refer to Moment 3: https://www.ahrq.gov/antibiotic-use/acute-care/four-moments/index.html
Nurse-driven IV To PO Programs: http://static1.1.sqspcdn.com/static/f/920943/28132630/1558564927807/Poster_Brenden.pdf?token=DYYc4nYDl92nt6901LH5ISr1zf8%3D
Nurse-drive stewardship Programs: https://pubmed.ncbi.nlm.nih.gov/32645472/
Economic and Clinical Outcomes of IV to PO Programs: https://pubmed.ncbi.nlm.nih.gov/24399573/
Suggestions for Ongoing Monitoring:
For ongoing monitoring of this scenario, continue to track quarterly data on use by IV and PO routes of administration (Figure 6). Figure 6 uses the same methods as Figure 1, just expanded to include 4 additional quarters.
Figure 6. Quarterly Doxycycline Use Stratified by Route for FACWIDEIN (2021-2022)
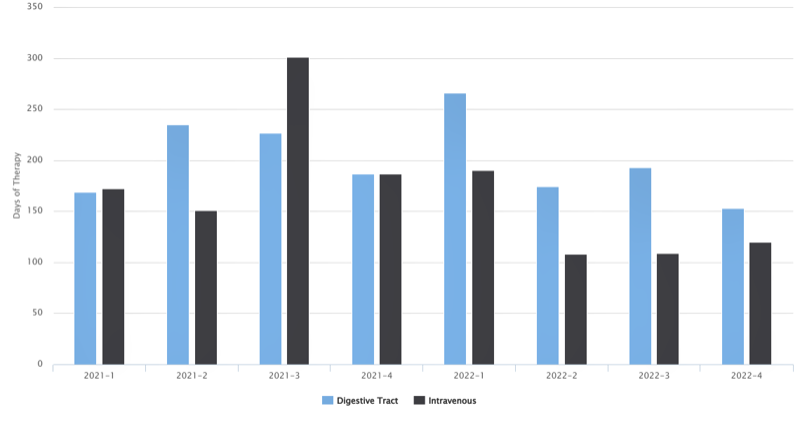
[Data Obtained From: NHSN-Analysis-Reports-Antimicrobial Use and Resistance Module- Antimicrobial Use Data-Line Listing-All Submitted AU Data for FACWIDEIN (modified per instructions in the metric guide: Antimicrobial use by route of delivery.]
Continuing to track doxycycline DOT over time will allow the stewardship team to ensure that the IV to PO conversion program is still being followed. If IV use appears to be increasing, the stewardship team can review additional data as described above.
In this example, quarterly data was selected given a relatively low number of administrations per month. When there are low rates of administration, variability can be seen between different time periods (as even one complicated patient can skew results). Combining data quarterly or yearly can help better overall interpretation.