Example Scenario: Through ongoing monitoring of the NHSN TAS Reports (see Table 1), you know that the WARDS in your facility have the highest SAAR values, with ceftriaxone being the highest used agent. Further, in the WARDS locations, the SAAR category with the highest value is the broad spectrum antibacterial agents predominantly used for community-acquired infections (BSCA).
The hospital locations included in the WARDS category are four distinct units: MED/SURG1, MED/SURG2, SURG and MED. These are each covered by a distinct group of providers. Patients on MED/SURG1 are cared for by a private group of general medicine providers without trainees and on MED/SURG2 care is provided by employed hospitalist providers with medical residents, SURG is all surgical providers and MED is a combination of medicine subspecialty providers (i.e. cardiology, nephrology).
The ASP has regular educational sessions for the medical residents. When comparative antibiotic prescribing data have been presented in the past, the residents insist they see variation in practice between patients cared for on the team with trainees vs. the team without trainees. In trying to assess the high antibacterial use in the WARDS locations, you also wish to assess if there might be differences by prescriber groups.
Background: The data captured in NHSN do not contain patient or prescriber-specific data. However, there are still several ways using the NHSN data that you can look for differences in practice between prescribers, particularly when there are firm geographic boundaries to where certain providers or provider groups practice (such as an individual unit or units). Similarly, sometimes prescribers rotate in monthly intervals which allows comparisons of data based on time to determine practice differences by prescribers. In this scenario, we demonstrate how to use AU data to identify prescriber or prescriber groups for stewardship intervention.
Manipulations of NHSN Extracts
Data Visualizations using NHSN AU Option TAS Reports to Identify Areas of High Use and Categories of Highest Use
Table 1. TAS Report- Adult SAAR Types- Location Groups (Separated)
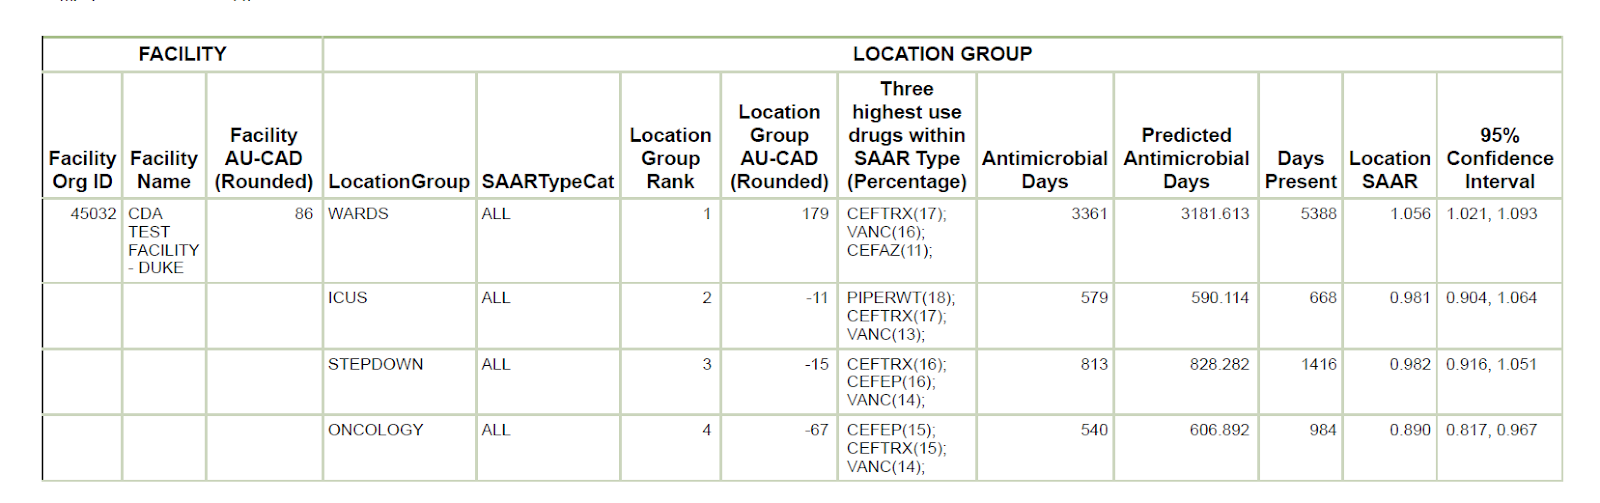
[Data Obtained From: NHSN-Analysis-Reports-Antimicrobial Use and Resistance Module- Targeted Assessment for Stewardship (TAS) Reports – TAS Report-Adult SAAR Types- Location Groups (Separated) metric guide: TAS Report- Location group-level]
What you will need for creating data visualization for Tables 1 & 2:
- Access to NHSN AU data in the Analysis tab in NHSN
For this table, you will use data extracted using the “TAS Report-Adult SAAR Types- Location Groups (Separated)” from the Analysis Tab in NHSN. More detailed instructions on how to manipulate this report within NHSN can be found in the CDC quick reference guide TAS Report- Location group-level.
Considerations for Interpretation The initial table on the NHSN output gives a quick summary of the various location types in this facility and their ranks in the All SAAR Type category. It is interesting to note, that the WARDS do have the highest SAAR for this particular facility. Some may look at the value and the fact that it is only slightly above one and decide this may not be an appropriate area for stewardship intervention, However, in this case, the SAAR is statistically significantly above 1 (95% confidence interval does not include 1) and even the most efficient stewardship programs still have opportunities to change and improve. In this example, we demonstrate how data can be leveraged to further inform stewardship work.
Table 2. TAS Report-Adult SAAR Types- Location Groups (Separated) Adult SAAR Types Location Groups Ranked by AU-CAD
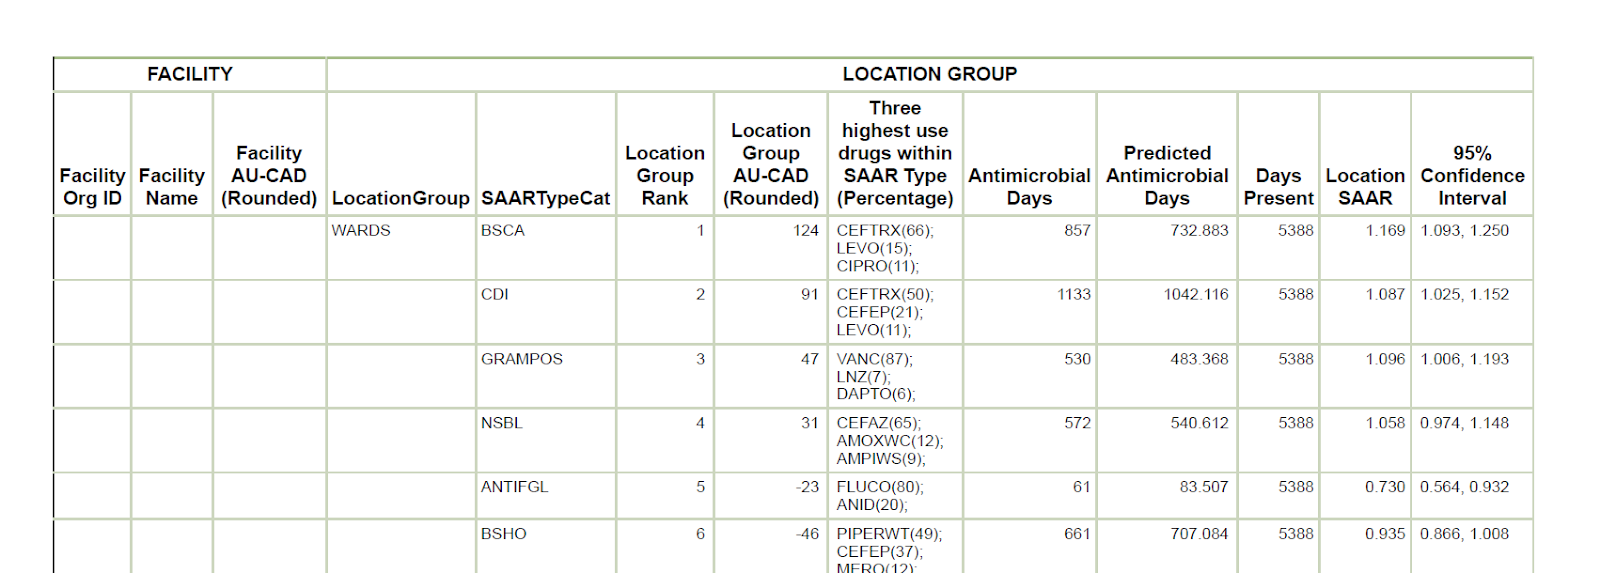
[Data Obtained From: NHSN-Analysis-Reports-Antimicrobial Use and Resistance Module- Targeted Assessment for Stewardship (TAS) Reports – TAS Report-Adult SAAR Types- Location Groups (Separated) metric guide: TAS Report- Location group-level]
Considerations for Interpretation The second table in the NHSN output drills down by each location type to show the ranked AU by SAAR category. For the WARDS category, which for this hospital includes the MED/SURG1, MED/SURG2, SURG and MED locations. For this grouping of locations, the BSCA agents have the highest SAAR. Ceftriaxone followed by levofloxacin and ciprofloxacin are the highest used agents in this category on the WARDS units.
Data Visualizations Using NHSN AU Option to Identify Variability in Antibiotic Use Between Units
Table 3. TAS Report-Adult SAAR Types- Location Groups (Combined) Adult SAAR Types Ranked by Location AU-CAD
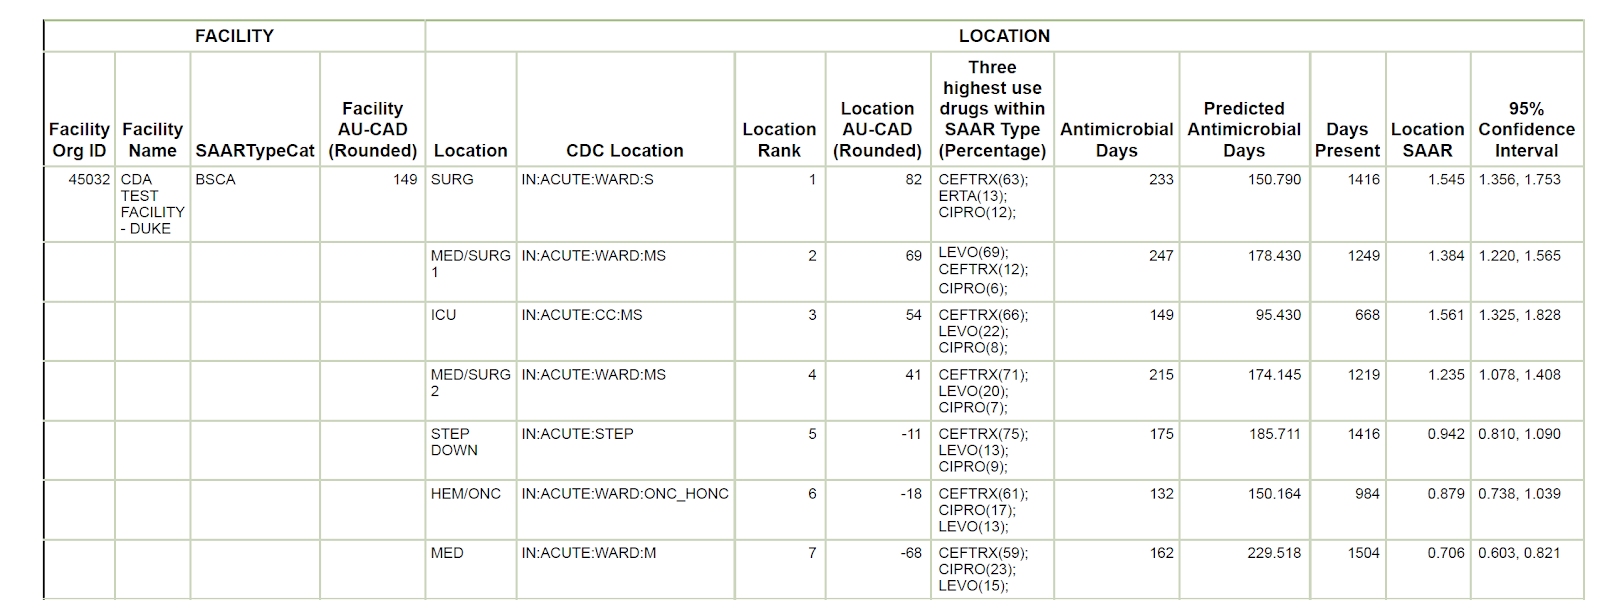
[Data Obtained From: NHSN-Analysis-Reports-Antimicrobial Use and Resistance Module- Targeted Assessment for Stewardship (TAS) Reports – TAS Report-Adult SAAR Types- Location Groups (Combined) metric guide: TAS Report- Locationlevel]
What you will need for creating data visualization for Table 3:
- Access to NHSN AU data in the Analysis tab in NHSN
Considerations for Interpretation In this table, taken directly from the NHSN export, you get a further drill down into the differences in antibiotic use by specific location within the WARDS grouping. The surgical location has the highest SAAR values, but the MED/SURG1 location has the second highest SAAR. When you look at the three highest use drugs within the SAAR type column (9th from the left), you notice a difference in practice for MED/SURG1 (levofloxacin use is 69% of drug use in this category) compared with MED/SURG2 (levofloxacin is 20% of use in this category). This is a variation from local guidelines for treatment of common infections which are intentionally fluoroquinolone-sparing.
Please note, an important consideration in this example is that many different unit types are included in the WARDS grouping. These each have different risk adjustment factors within NHSN for calculating the SAAR due to differences in the patient populations. Be cautious when comparing prescribing rates between different unit types. In this example, MED/SURG1 and MED/SURG2 are both mixed medical-surgical wards caring for very similar patient populations. The main difference is the provider groups practicing in these locations. Local stewards or infection preventionists would have the best understanding of which hospital locations are appropriate for such comparisons.
Metrics Using Local Data Sources (Augmented Data)
Data Visualizations using Augmented Data for Provider-Specific Prescribing Rates
Not all facilities will have prescribers who work in such specific facility locations as the hospital in this example. In some cases, with additional information technology support at the facility-level, data on specific prescribers can be obtained with a few simple data manipulations.
Figure 1. Levofloxacin Days of Therapy (DOT) by Prescriber (Blinded)
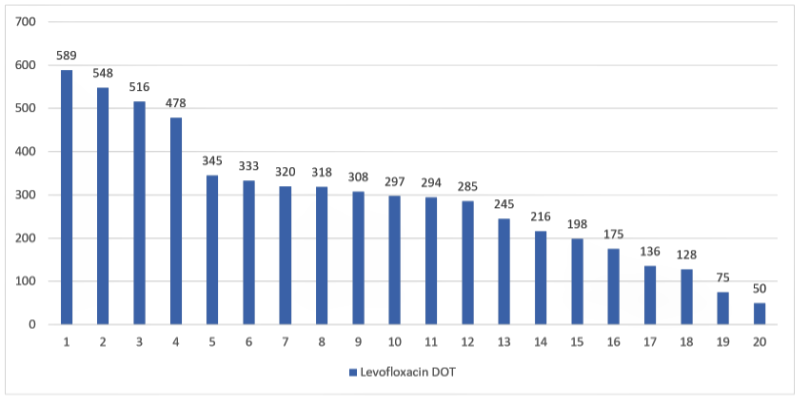
[Data Obtained From: Local Data Extracts-– Further instructions on how to manipulate these data using the metric guide: Antibiotic Use by Prescriber in Days of Therapy (DOT).]
What you will need for this data visualization for Figure 1:
- Access to local antimicrobial prescribing data that includes administrations or orders that includes the prescriber and the facility location.
- Access to Excel™ or other spreadsheet software.
Considerations for Interpretation The data in this visualization is presented as raw DOT by prescriber. This can be difficult to interpret if prescribers have variable schedules (such as some being part time). However, in these data a clear pattern emerges that four of the prescribers account for much of the levofloxacin use (in this case it is actually 36% of the total DOT for the facility- calculation not shown).
Menu of Stewardship Interventions:
To address the high rate of levofloxacin by a select provider group or targeted providers, there are several potential stewardship interventions. Importantly, some broad interventions like updating clinical use guidelines will not be as helpful in this scenario as some prescribers clearly have a variation in practice.
A key component of approaching targeted prescriber(s) for areas of antibiotic use that is considered an outlier is to listen to the prescriber about their perception regarding current practices. There can be a lot to learn in these discussions.
- Share data on prescriber-specific antibiotic use with the prescribers who are high users (or consider sharing the full dataset with all of the medicine prescribers).
- Are there specific clinical scenario where the prescribers are using levofloxacin and do not prefer ceftriaxone?
- Are the prescribers aware of existing guidelines for treatment of common infections which have been established at your hospital for some time?
- Have the prescribers noticed treatment delays, failures, complications with other alternative antibiotic therapies.
- Review cases of levofloxacin use on both MED/SURG1 and MED/SURG2 to notice difference in clinical indication or other uses. (Data Would be Obtained From: Local Data Extracts- key considerations are discussed in this metric guide: Antibiotic Use by Prescriber in Days of Therapy. – Further instructions on how to manipulate these data using the metric guide: Provider Specific Prescribing Stratified by Route or Indication]
Resources:
Pew Report: A Path to Better Antibiotic Stewardship in Inpatient Settings
Examples for providing feedback taken from the outpatient setting: Meeker D, Linder JA, Fox CR. Effect of behavioral interventions on inappropriate antibiotic prescribing among primary care practices. A randomized clinical trial. JAMA 2016;315:562-70.
Suggestions for Ongoing Monitoring:
For ongoing monitoring of this scenario, continue to track the SAAR values on the TAS reports as described for Tables 1 and 2. This will be the easiest and most simple way to track trends in these data. An alternative is to use the SAAR Plot functionality within NHSN as is depicted below.
Figure 2. SAAR Plot for BSCA SAARs in WARDS Displayed Monthly
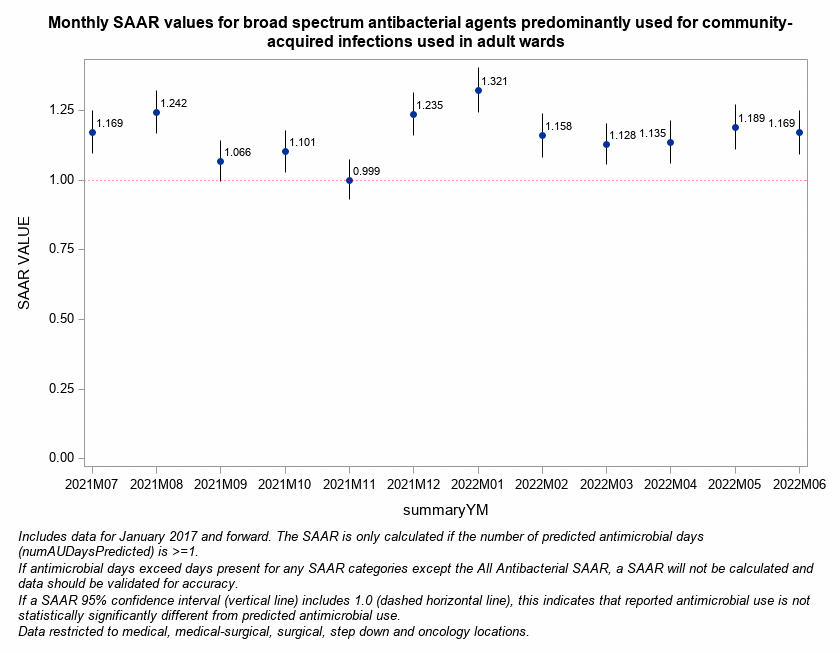
[Data Obtained From: NHSN-Analysis-Reports-Antimicrobial Use and Resistance Module- Antimicrobial Use Data-SAAR Plot- All Adult and Pediatric SAARS (2017 Baseline)- modified under Filters to add SAARType-2017 equal Broad spectrum antibacterial agents predominantly used for community-acquired infections used in adult SAAR wards].