Example Scenario: During a quarterly staff meeting at the hospital, several pharmacists mentioned they noticed an increase in the use of ceftriaxone for treatment of positive urinalysis in general adult ward patients. Upon further investigation with NHSN data, the antimicrobial stewardship team noticed that the SAAR for broad spectrum antibacterial agents predominantly used for community-acquired infections (BSCA) in the wards remained statistically significantly above 1 throughout most of the past fiscal year (Figure 1).
There are a number of units that are included in the WARDS SAAR value and among those units, there are monthly rotating resident teams, a hospitalist group, and a surgeon group. It is prudent to evaluate BSCA use on these WARDS as well as the providers prescribing to determine if a potential antimicrobial stewardship intervention targeting treatment of asymptomatic bacteriuria will reduce the WARDS SAAR for this category.
Background: The data captured in NHSN do not contain patient or prescriber-specific data. However, there are ways to leverage the data available in NHSN that allows the steward to narrow down and identify targeted patient populations for further investigation. This will help identify interventions that specifically target the areas of excess or unnecessary antibiotic use identified with the NHSN reports. When possible, these can also be combined with specific institutional data. In this scenario, we demonstrate how to use AU data to identify specific antimicrobials and targeted populations for stewardship intervention.
Manipulations of NHSN Extracts:
Data Visualizations using NHSN AU Option SAAR Plot
Figure 1. SAAR Plot Filtered by CABSA
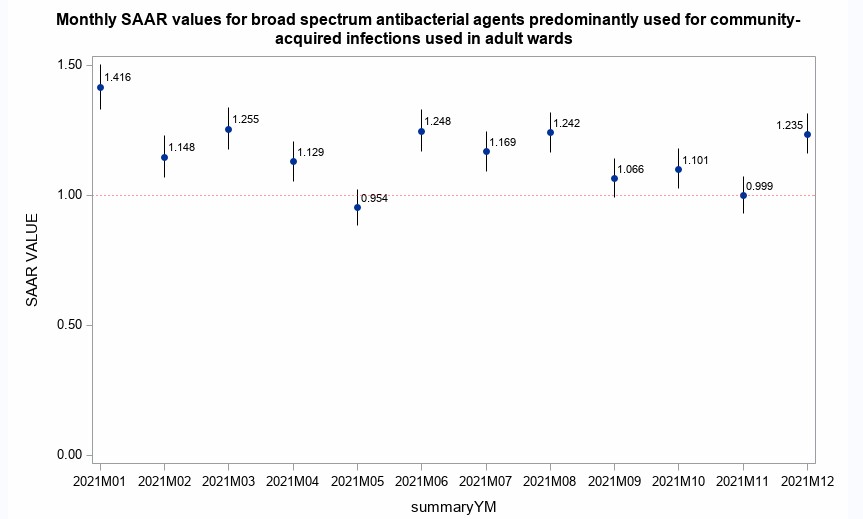
[Data Obtained From: NHSN-Analysis-Reports-Antimicrobial Use and Resistance Module-SAAR Plot]
What you will need for creating this data visualization:
- Access to NHSN SAAR Plot
Considerations for Interpretation: The initial SAAR Plot output that NHSN gives is a quick summary of the BSCA use in the adult wards at the institution. This is a necessary first step to evaluate if the agent in question (in this example, the pharmacists who felt there was increased use of ceftriaxone) could in fact be an area of excess use. The BSCA group was selected because it includes ceftriaxone. The listing of agents included in each SAAR grouping can be found in Appendix E of the 2023 version of the NHSN Safety Component Manual.
For this plot, you will use data from the “SAAR Plot- All Adult and Pediatric SAARs (2017 Baseline)” from the NHSN Analysis tab. For this case, the SAAR plot is prepared for the broad spectrum agents There is a provided plot that can be downloaded, or the data utilized to create the plot may be exported into ExcelTM and manipulated as needed.
NHSN TAS report
Figure 2. TAS Report - Adult SAAR Types - Locations
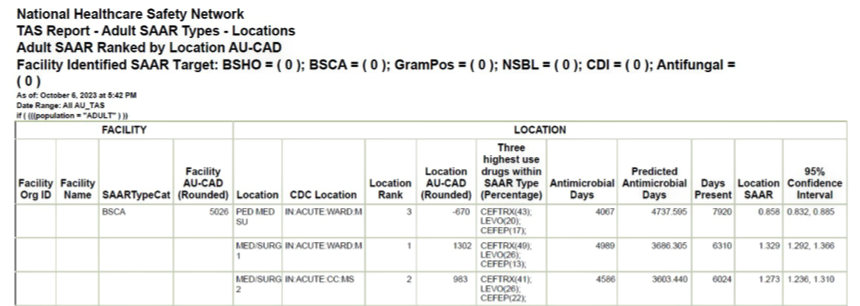
[Data Obtained From: NHSN-Analysis-Reports-Antimicrobial Use and Resistance Module- TAS report Adult SAAR Types- Locations Targeted Assessment for Stewardship (TAS) Report: Locations]
What you will need for creating this data visualization:
- Access to NHSN TAS Report
Considerations for Interpretation: After determining the elevated SAAR values on the WARDS was consistent throughout the year, a TAS Report may be run to determine the top agent driving elevated SAARs in specific SAAR types and in specific locations throughout the institution. Based on the above visualization, ceftriaxone is the highest utilized drug in the BSCA SAAR type for MED/SURG 1 and 2.
NHSN Report Antimicrobial Use Bar Chart
Figure 3. Antimicrobial Use Data by Antibacterial Class and Location
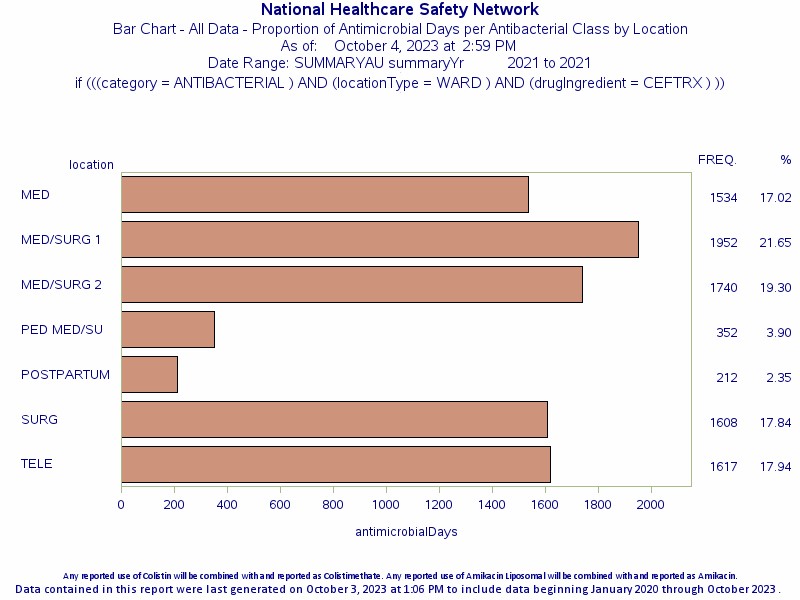
[Data Obtained From: NHSN-Analysis-Reports-Antimicrobial Use and Resistance Module-AU Bar Chart-All AU Data by Antibacterial Class and Location- restricted to WARD locations and Ceftriaxone for drug ingredient]
What you will need for creating this data visualization:
- Access to NHSN Bar Chart
Considerations for Interpretation: The initial Bar Chart output that NHSN gives is a quick summary of the ceftriaxone use in the various WARDS at the hospital. Based on this, the WARDS with the highest ceftriaxone utilization in adults are the medical/surgical WARDS.
Metrics Using Local Data Sources (Augmented Data)
Prescriber-Specific Antibiotic Use Reports Using Local Data
Figure 4. Ceftriaxone Days of Therapy (DOT) by Prescriber for High Utilization Unit (Blinded)
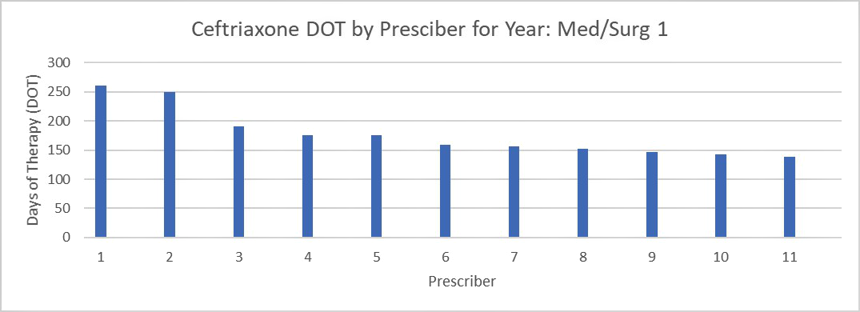
Figure 5. Ceftriaxone Days of Therapy (DOT) by Indication for High Utilization Unit (Blinded)
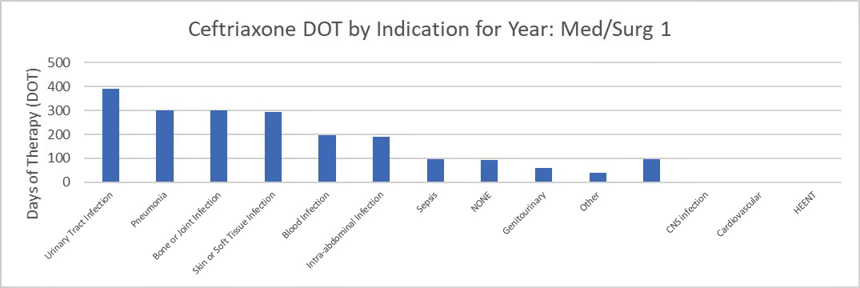
[Data Obtained From: Local Data Extracts- key considerations are discussed in this metric guide: Agent use by indication]
What you will need for Figure 4 data visualization:
- Prescriber information
- Access to local antimicrobial prescribing data that includes administrations or orders that includes the prescriber and the facility location.
- Access to Excel™ or other spreadsheet software.
What you will need for Figure 5 data visualization:
- Indication Information
- Access to local antimicrobial prescribing data that includes administrations or orders that includes the prescriber, the facility location and a reason for use.
- Access to Excel™ or other spreadsheet software.
Considerations for Interpretation The data in this visualization is presented as raw DOT by prescriber or indication. For prescriber DOT, the data can be difficult to interpret if prescribers have variable schedules (such as some being part time). However, in these data a clear pattern emerges that two of the prescribers account for much of the ceftriaxone use (in this case it is actually 26% of the total ceftriaxone DOT for the facility- calculation not shown).
The data by indication in Figure 5 is also presented as raw DOT and by a simplified indication. For institutions without required indication on order entry, this data can be difficult to collect. An alternative method would be to use diagnosis codes to determine potential indications (see Targeted Admission Denominator for example of diagnosis code utilization). If data extracts include patient demographics such as age or gender, these would be useful areas to investigate and identify if an intervention is needed (e.g., patients >65 years old may be at higher risk for ASB treatment). You will see here that as suspected by the pharmacists; urinary tract infection is the top reason for use of ceftriaxone on one of the medical/surgical units.
Figures 6 & 7. Antibiotic Prescribing Practices for Urinary Tract Infections (UTIs) by High Use Providers
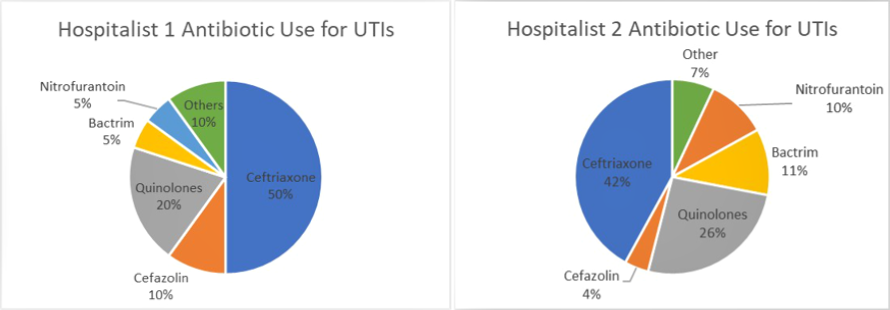
Data Obtained From: Local Data Extracts- key considerations are discussed in this metric guide: Antibiotic Use by Prescriber Days Of Therapy (DOT) Stratified by Route or Indication]
Considerations for Interpretation The data in this visualization is presented as the percentage of the raw DOT by antibiotic. By drilling down into the high use prescribers on the unit for this specific diagnosis, there are other opportunities that may present themselves and allow for a more robust stewardship intervention (e.g. fluoroquinolone use). Further data that may be extracted via manual chart review that would be useful to move forward would be the asymptomatic bacteriuria treatment rate for these high use providers.
Menu of Stewardship Interventions:
To address the high rate of ceftriaxone use in UTIs on specific units or for specific providers, there are several potential stewardship interventions.
- Create Ceftriaxone UTI report: This can be accomplished within electronic medical records that have scoring tools or in other systems utilized for stewardship programs for alerts and reporting. Some potential categories to include in the report include:
- Age Over 65
- Ceftriaxone prescribed for UTI
- PLUS
- Absence of pyuria
- OR
- Afebrile AND Presence of pyuria AND normal WBC
- OR
- Presence of pyuria and presence of fever OR elevated WBC AND urine culture susceptible to cefazolin
- Practice Advisory or Alert Upon Order Entry of Urinalysis with Reflex or Urine Culture: Provider advisory or alerts may be a helpful tool to stop treatment prior to starting. Interventions at order entry may be useful, especially in disease states with shorter treatment durations. Often in these disease states, the audit and feedback workflow may provide interventions too late in the course.
- Nursing Education: Specific unit nursing education may be useful specifically for reducing asymptomatic bacteriuria treatment as they are the personnel working closest with the patient and are able to determine if a patient has true symptoms of infection when urinalysis results return and provide that rationale to providers.
Suggestions for Ongoing Monitoring:
For ongoing monitoring of this scenario, continue to track SAAR values on the TAS reports (described in Figure 2) as these are the easiest way to trend recent data. An alternative is to use the SAAR Plot functionality described in Figure 1.
Post-education or intervention MUE may also be useful for this specific scenario as the focus is asymptomatic bacteriuria which is difficult to identify with high level data and would need manual data extraction.