Example Scenario: You are a stewardship pharmacist at a medium sized hospital and have noticed that the SAAR for the antibacterial agents predominantly used for resistant Gram-positive infections has been high for some time.
Background: Previous examples have demonstrated how useful the TAS reports can be in identifying specific SAAR categories and agents within a SAAR category where antibiotic use may be high (See Scenario 1-1). In this example, we demonstrate additional NHSN tools that can assist with identifying specific agents where use of a particular agent within a SAAR category might be a target for stewardship intervention. This sort of analysis might also be particularly helpful in cases where you are tracking use of a specific agent, such as one that is restricted or considered non-formulary and therefore may not appear as one of the highest use agents in the TAS functionality.
Manipulations of NHSN Extracts
Using NHSN AU Option Bar Chart Functionality to Drill Down on a Category of High Use or Bar Chart - All Data - Selected Agent Distribution by Month
This graph is prepared directly within the NHSN analysis tool using the selection: Bar Chart- All Data- Selected Agent Distribution by Month. This pre-set function can easily be modified to only include the agents of interest. The template has it built with a selection of drugs already identified in the Filters tab. Simply go into the tab and select the agents of interest to you. The pre-built analytics within NHSN already has templates built out to the antifungal and anti-influenza agents as well.
Figure 1. Bar Chart - All Data - Selected Agent Distribution by Month
[Data Obtained From: NHSN-Analysis-Reports-Antimicrobial Use and Resistance Module- Antimicrobial Use Data– Bar Chart- All Data-Selected Agent Distribution by Month (modified to include ceftaroline, linezolid, and daptomycin only and display options for 1) chart variable of summaryYQ, 2) stratification variable of drugDescription, and 3) Page by of orgID). Additional instructions for modification can be found in the quick reference guide: Antimicrobial Use Bar Chart- Selected Drugs.]
What you will need for creating data visualization for Figure 1:
- Access to NHSN AU data in the Analysis tab in NHSN
Considerations for Interpretation The output for this bar chart is provided in days of therapy per days present. This is an easy way to prepare a graph that shows time-trended use data for specific agents of interest. This chart might be helpful when there is a single agent that you know is contributing a lot of use, but you want a clearer view of the other contributors. In this case, the stewardship team is aware that vancomycin is the agent most used in this category but wants to investigate other contributors to the high SAAR. This graph shows that linezolid use has been decreasing with time but daptomycin use has been more variable and has not seen decreases despite both linezolid and daptomycin being restricted agents.
Figure 2. Pie Chart - All Data - Proportion of Antimicrobial Days per Antibacterial Class by Location (SURG & TELE)
Figure 3. Pie Chart - All Data - Proportion of Antimicrobial Days per Antibacterial Class by Location (MED/SURG1 & MED/SURG2)
[Data Obtained From: NHSN-Analysis-Reports-Antimicrobial Use and Resistance Module- Antimicrobial Use Data-Pie Chart-All AU Data by Antibacterial Class and Location (modified to include ceftaroline, linezolid, and daptomycin only and display options chart variable of drug ingredient. Additional Instructions for modification can be found in the quick reference guide: Antimicrobial Use Pie Chart.
What you will need for creating data visualization for Figures 2 & 3:
- Access to NHSN AU data in the Analysis tab in NHSN
Considerations for Interpretation The output you receive will give you a pie chart for every location in the facility. For simplicity, just four units are displayed here. A quick look at the data indicates that when using non-vancomycin agents in the resistant Gram-positive infections category, daptomycin is used approximately half of the time on MED/SURG1 and more than half the time on the SURG unit. These may highlight areas for further review by the stewardship team and possible future intervention.
Using Antimicrobial Resistance Data
What you will need for this data visualization for Figure 3:
- Access to NHSN AR data in the Analysis tab in NHSN
Figure 3- SRIR Report - All Standardized Resistant Infection Ratios for Vancomycin-Resistant Enterococcus in Blood and Sputum Specimens (2019 Baseline)
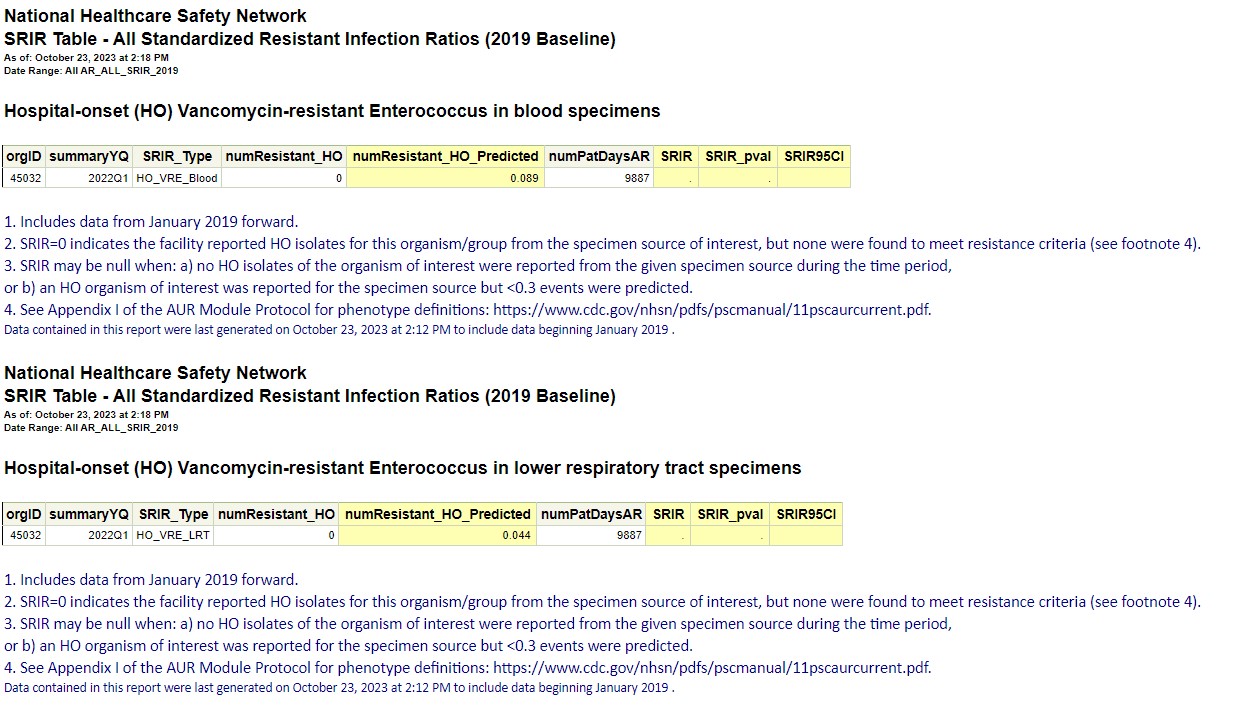
[Data Obtained From: NHSN-Analysis-Reports-Antimicrobial Use and Resistance Module-Antimicrobial Resistance Data-SRIR Report- All Standardized Resistant Infection Ratios for more information on using these data refer to the quick guide: ]
Considerations for Interpretation In this scenario, one reason that was identified for possible high use of daptomycin was empiric coverage for patients at risk for bloodstream and other infections due to vancomycin-resistant Enterococcal infections. Using the antibiotic resistance data submitted, you can confidently inform prescribers that for the period from January 2019 forward, this facility actually had no hospital-onset vancomycin-resistant enterococcal infections in the blood or lung (which would not be treated by daptomycin anyway). These data were easily obtained from the standardized resistant infection ratio (SRIR) reports, but additional line listing options are available within NHSN. More information can be found in a series of quick reference guides.
Potential Stewardship Interventions:
To address the high rate of daptomycin prescribing seen on the surgery and MED/SURG1 units, consider the following stewardship intervention: Conduct a medication use evaluation to determine the reasons that daptomycin is being used in this setting. A MUE is best because these agents are restricted to approval and therefore the ordering provider may not reflect the individual approving the drug.
- Review the restriction criteria currently in place for linezolid and daptomycin to see if
- the current criteria being followed;
- there are barriers to the current restriction protocol such as lack of prescribers to cover overnight that might be leading to increased use;
- if current criteria should be revised based on new clinical data, a new patient population receiving care at your facility or other emerging data.
These questions can help identify if you might need modifications to the existing restriction program, education for providers on the units that are high users or both.
Resources:
Meta-Analysis of Antibiotic Restriction Programs: https://pubmed.ncbi.nlm.nih.gov/33880388/
Priority Areas for Antimicrobial Stewardship: https://www.cdc.gov/antibiotic-use/core-elements/hospital/priorities.html
Suggestions for Ongoing Monitoring:
For ongoing monitoring of this scenario, continue to track the SAAR values. An easy way to do this is by routinely viewing the SAAR Plot for the category. Since the highest use was in the WARD areas, it is best to target these specific interventions to the WARD units (of course, continue to monitor overall SAARs per routine stewardship work).
Figure 4. SAAR Plot for MRSA SAARs in WARDS Displayed Monthly
[Data Obtained From: NHSN-Analysis-Reports-Antimicrobial Use and Resistance Module- Antimicrobial Use Data-SAAR Plot- All Adult and Pediatric SAARS (2017 Baseline)- modified under Filters to add SAARType-2017 equal Broad spectrum antibacterial agents predominantly used for resistant Gram-positive infections used in adult SAAR wards].