Example Scenario: Broad-spectrum antibiotic use in the NICU
Your hospital has noted that the neonatal broad spectrum antibacterial agents predominantly used for hospital-onset infections (BSHO) SAAR in the level II neonatal stepdown unit has been higher than expected for the past 3 years. The stewardship team wants to evaluate the appropriateness of this use and develop a plan to reduce any inappropriate use of these agents. The stewardship team will also identify whether empiric prescribing or prolonged durations are driving this use on the level II neonatal stepdown unit and how commonly these antibiotics are prescribed among all patients who receive antibiotics on the unit.
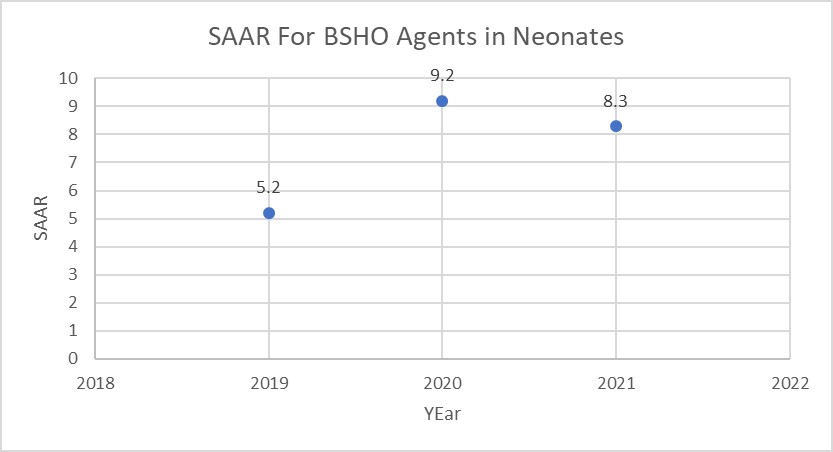
Background: The neonatal SAAR was the last to be developed, and was first implemented at Duke in Q4 2021. These data illustrated significantly high BSHO SAARS in the level II neonatal stepdown unit: 5.2 in 2019, 9.2 in 2020 and 8.3 in 2021. In the neonatal population the specific agents include: cefepime, piperacillin-tazobactam and carbapenems.
Manipulations of NHSN Extracts
Data Visualizations for SAAR Plot of Broad-spectrum Antibacterial Agents Predominantly Used for Hospital-onset Infections (BSHO) in the Neonatal Population
Figure 1. SAAR Values for Neonatal BSHO Agents
[Data Obtained From: NHSN-Analysis-Reports-Antimicrobial Use and Resistance Module- SAAR Report- All Adult and Pediatric SAARS exported to ExcelTM Further Information can be obtained in this CDC Quick Resource Guide- Antimicrobial Use SAAR Baseline Rate Tables]
What you will need for this data visualization:
- NHSN Report SAAR Report
Considerations for Interpretation: The NHSN SAAR data gives a summary of the SAAR values for the various SAAR Types for Neonates (e.g. BSHO, Vancomycin, 3rd generation cephalosporin, Aminoglycosides, etc.). This is a potential first step in identifying areas in the neonatal population that may have higher than expected utilization. The report in NHSN was exported to ExcelTM and put into a modified SAAR plot to trend the values over the years (but similar output can be obtained using the SAAR plot modified to display by year). Based on the visualization above, the SAAR value has increased since 2019 and may be an area of further investigation.
TAS Report – Neonatal SAAR Types – Locations
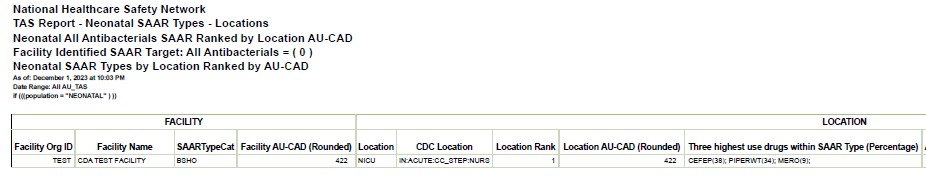
Figure 2. TAS Report for Neonatal SAAR Types by Location
[Data Obtained From: NHSN-Analysis-Reports-Antimicrobial Use and Resistance Module- TAS report-Neonatal SAAR Types-Locations]
What you will need for this data visualization:
- NHSN Report TAS Report
Considerations for Interpretation: A TAS Report may be run specifically for neonatal units and SAAR types to help determine top agents driving elevated SAARs in specific SAAR types. Based on the above visualization, the NHSN data shows that cefepime, piperacillin-tazobactam, and carbapenems were top agents of use in the BSHO category for neonates. The AU-CAD listed on the TAS report represents the number of antimicrobial days needed to achieve a desired SAAR target. This particular TAS report has a SAAR target set at 1 (this can be individualized per report if an institution has different SAAR targets).
Metrics Using Local Data Sources (Augmented Data)
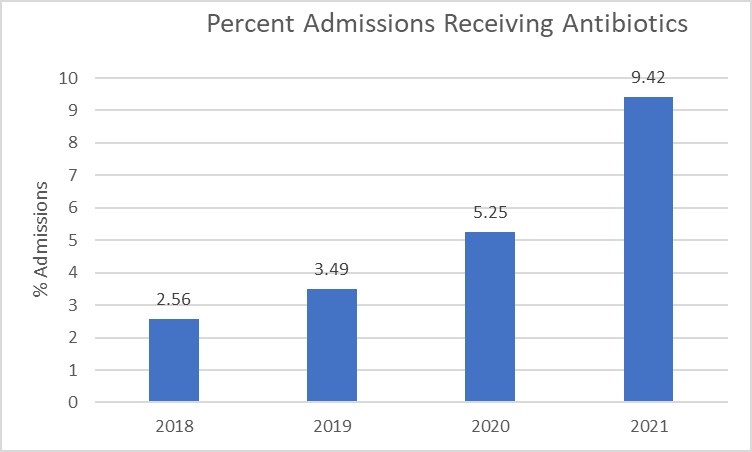
Figure 3. Percent of Neonatal Admissions Receiving Cefepime and Piperacillin-Tazobactam
[Data Obtained From: Local Data Extracts- key considerations are discussed in this metric guide: Percent of Patient Admissions Receiving a Specific Antimicrobial]
What you will need for this data visualization:
- Count of Neonatal Admissions Receiving Cefepime and Piperacillin-Tazobactam
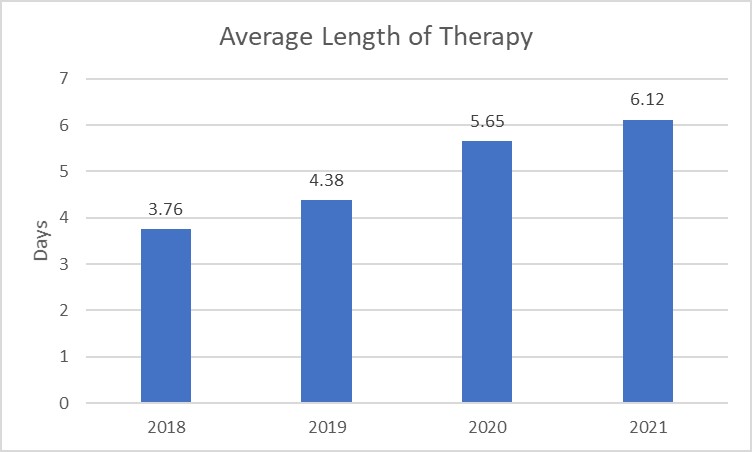
Figure 4. Cefepime and Piperacillin-Tazobactam Length of Therapy by Neonatal Admission
[Data Obtained From: Local Data Extracts- key considerations are discussed in this metric guide: Antimicrobial-specific Average Length of Therapy]
What you will need for this data visualization:
- Antimicrobial Days for Cefepime and Piperacillin-Tazobactam in Neonates
Considerations for Interpretation: The data in these visualizations will require using the institution’s own data extracts (Figures 3-4). Based on the visualizations above, the percent of admissions receiving cefepime and piperacillin-tazobactam has steadily increased over the past 4 years and the length of therapy at the institution also continues to increase over the years. The number of admissions receiving antibiotics has a higher percent change compared to the length of therapy, however both initiation and duration may be appropriate targets based on the data.
Menu of Stewardship Interventions:
To address the high rate of BSHO use on the neonatal stepdown unit, the length of therapy and percent of admissions receiving BSHO agents were both identified as increasing issues over the recent years. Based on the visualization data, there are several potential stewardship interventions.
- Reduce Empiric Use of Cefepime and Piperacillin-tazobactam
- Assess microbiology data to determine responsible pathogens for infections in the institution’s NICU
- Review local resistance data from the antibiogram to see if there’s a potential justification for higher use within the hospital.
- Create empiric use guidelines for this population to ensure appropriate narrow spectrum agents are used
- Reduce Length of Therapy/De-escalation interventions
- Education on reassessment of antimicrobial treatment when culture results are available
- Audit-and-feedback
- Local guidelines with a focus on short standardized treatment durations
Suggestions for Ongoing Monitoring:
For ongoing monitoring of this scenario, continue to track SAAR values on the TAS reports (described in Figure 2) as these are the easiest way to trend recent data. An alternative is to use the SAAR Plot/Report functionality described in Figure 1.
Post-education or intervention MUE may also be useful for this specific scenario as the focus is for a specific unit and population and specific data may be difficult to identify with high level data.