Example Scenario:
The stewardship team has noticed increased IV vancomycin consults on the hematology-oncology ward. The hospital’s SAAR for Gram positive agent use also indicates above expected use on this unit. The stewardship team decides to drill down into Gram positive agent use on this unit to see whether or not the driver of high use is empiric prescribing or long durations of therapy to determine a strategy to best help reduce the use of Gram positive agents.
Background: Often, hospitals may only have one or two units of a particular NHSN category. One example of this is units that care for oncology patients. Given the high risk for infection and frequent need to prophylactic or empiric antibiotics, it can be hard to assess when burden of use is truly high vs. a particular unit type just means higher antibiotic use. In this case, the SAAR data can be used to confirm that use is elevated compared with other units caring for similar high risk patients.
Manipulations of NHSN Extracts
Data Visualization for SAAR Plot of Agents Predominantly Used for Resistant Gram-positive (GRAMPOS) Infections in Targeted Unit Types
Figure 1. SAAR Plot Filtered by GRAMPOS on Oncology Wards
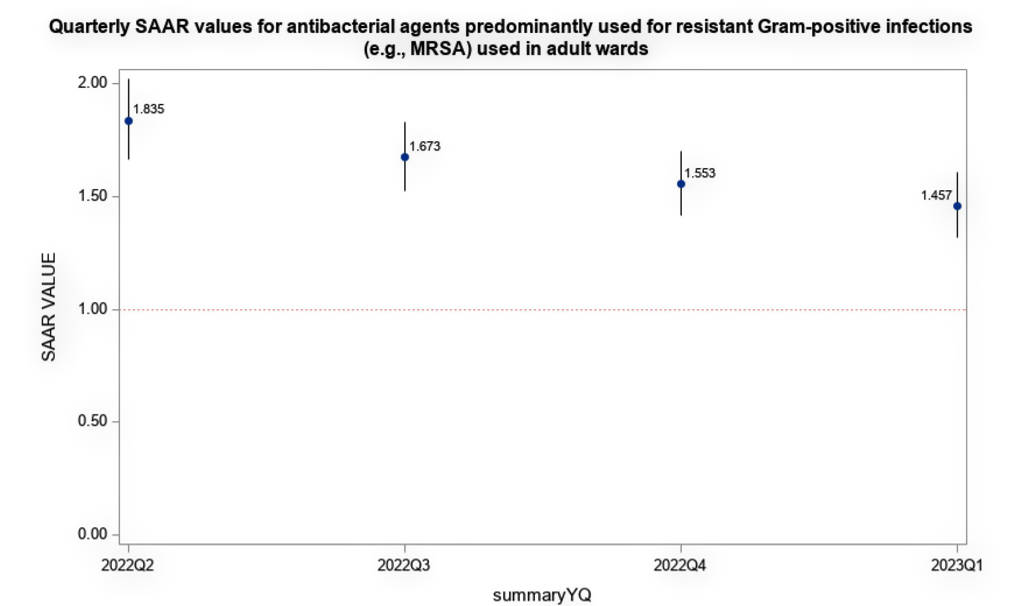
[Data Obtained From: NHSN-Analysis-Reports-Antimicrobial Use and Resistance Module SAAR Plot-All Adult, Filtered to locCDC equals Oncology General Hematology-Oncology Ward and display changed to Group By SummaryYQ]
What you will need for this data visualization:
- Access to NHSN SAAR Plot
Considerations for Interpretation: The NHSN SAAR Plot output gives a quick summary of the SAAR types for the hematology/oncology units within the institution. In order to narrow down the plot visualization, the report must be filtered by SAARType and location within the instution. Based on the visualization above, the SAAR for GRAMPOS agents has been consistently greater than 1 over the past year and confirms suspicions by the clinical pharmacists.
Figure 2. TAS Report by Location
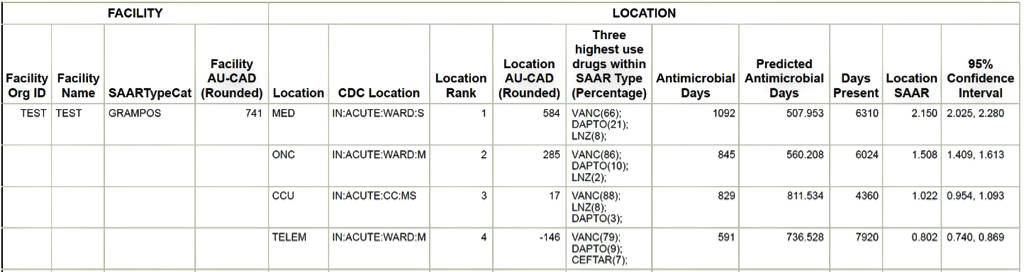
[Data Obtained From: NHSN-Analysis-Reports-Antimicrobial Use and Resistance Module- TAS report Adult SAAR Types- Locations Targeted Assessment for Stewardship (TAS) Report: Locations]
What you will need for this data visualization:
- Access to NHSN TAS Report
Considerations for Interpretation: A TAS Report may be run to determine the top agent driving elevated SAARs in specific SAAR types and in specific locations throughout the institution. Based on the above visualization, vancomycin is the highest utilized drug in the GRAMPOS SAAR type for all units. As this example is specifically about addressing vancomycin utilization on the heme/onc wards, these will be the units to focus on. From the visualization, vancomycin makes up 86% of the use in the GRAMPOS SAAR category.
Figure 3. Rate Days Present for Vancomycin on Oncology Wards in Past Year
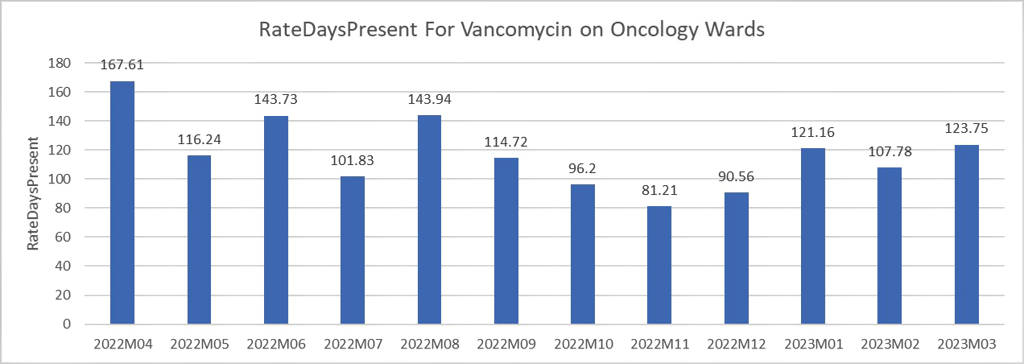
[Data Obtained From: NHSN-Analysis-Reports-Antimicrobial Use and Resistance Module- Rate Table (modified per instructions in the metric guide: Specific Antimicrobial Use Bar Chart)]
What you will need for this data visualization:
- Access to NHSN Rate Table Report
Considerations for Interpretation: The NHSN Rate Table data may be exported into ExcelTM and manipulated as needed. For this visualization, the Rate Table data was first filtered by drug of interest and location of interest. Within ExcelTM a chart was created to trend utilization over the last year. This data is most helpful if providers on the units of interest rotate on a monthly schedule, as it could help narrow down to a provider or provider group that is driving utilization. For this example, there are not any distinct trends although March, June and August may be of interest to evaluate provider schedule to determine if this is a potential education target.
Metrics Using Local Data Sources (Augmented Data)
Data Visualization Determining if High Empiric Use or Long Durations are the Cause of High Use Rates
Figure 4. Percent of All Admissions Receiving Vancomycin
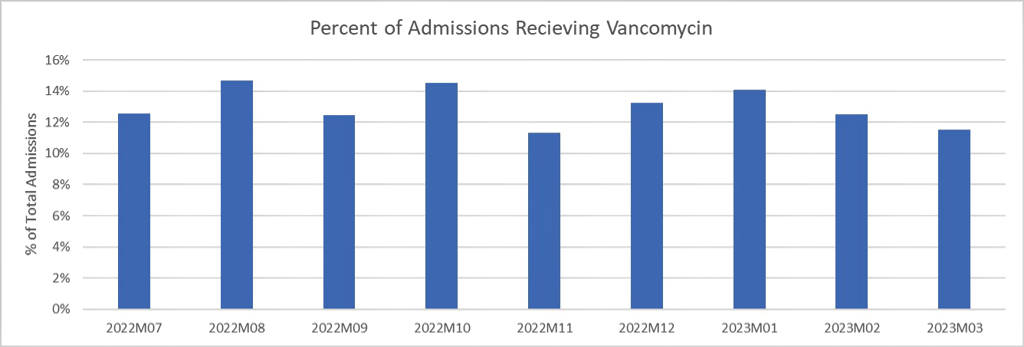
[Data Obtained From: Local Data Extracts- key considerations are discussed in this metric guide: Percent of Patient Admissions Receiving a Specific Antimicrobial]
What you will need for this data visualization:
- Count of All Admissions Receiving Vancomycin by Month
Figure 5. Vancomycin Length of Therapy by All Admissions at Institution
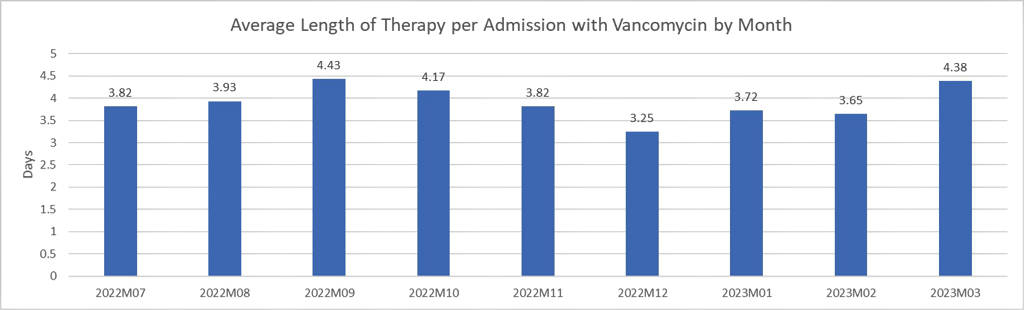
[Data Obtained From: Local Data Extracts- key considerations are discussed in this metric guide: Antimicrobial-specific Average Length of Therapy]
What you will need for this data visualization:
- Count of All Admissions Receiving Vancomycin by Month
Figure 6. Percent of Admissions on Oncology Ward Receiving Vancomycin
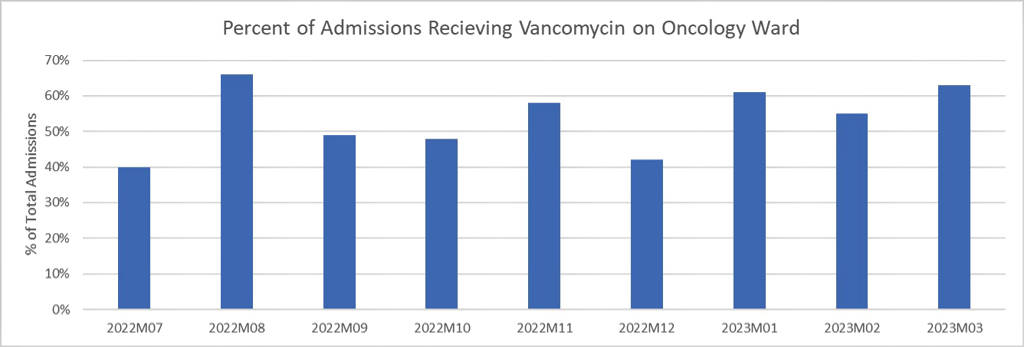
[Data Obtained From: Local Data Extracts- key considerations are discussed in this metric guide: Percent of Patient Admissions Receiving a Specific Antimicrobial]
What you will need for this data visualization
- Count of All Admissions Receiving Vancomycin for Oncology Ward by Month
Figure 7. Vancomycin Length of Therapy by Oncology Admissions
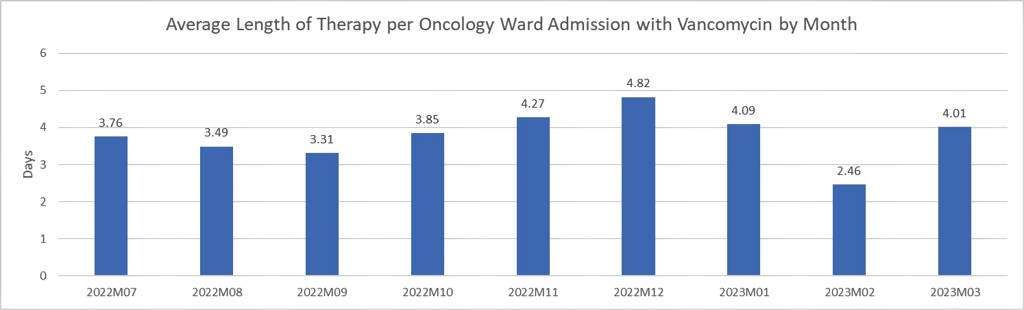
[Data Obtained From: Local Data Extracts- key considerations are discussed in this metric guide: Antimicrobial-specific Average Length of Therapy]
What you will need for this data visualization
- Antimicrobial Days for Vancomycin by Oncology Admissions and Month
Considerations for Interpretation: The data in these visualizations include NHSN data and non-NHSN data incorporated into an ExcelTM. Using NHSN data, percent of admissions receiving vancomycin for FACWIDEIN can be calculated by using the total admission days from the Vancomycin Line Listing Report and the number of admissions receiving vancomycin from the institution’s own data extracts (Figure 4). These data can then be combined utilized to find the average length of therapy of vancomycin per admission (Figure 5). Average length of therapy can be calculated by utilizing NHSN’s antimicrobial days of vancomycin from the Line Listing report and the number of admissions receiving vancomycin from the intuition’s own data extracts.
Narrowing this data down to unit specific information will require using the institution’s own data extracts (Figures 6-7). Based on the visualizations above, the percent of admissions receiving vancomycin at the institution is lower than the percent admissions receiving vancomycin on the oncology ward, but the length of therapy at the institution and on the oncology ward remain largely consistent. An ideal target to reduce vancomycin on this ward is appropriate initiation of vancomycin. Length of therapy may also be a target as many of the average durations are above 3 days and there are many stewardship interventions that help reduce average durations to less than 3 days.
Menu of Stewardship Interventions:
To address the high rate of vancomycin, use on the oncology wards, the length of therapy and percent of admissions receiving vancomycin were both evaluated and compared to the rest of the institution. Based on the visualization data, there are several potential stewardship interventions.
- Reduce Empiric Use of Vancomycin
- Assess microbiology data to determine frequency of invasive MRSA infection in this population
- Create empiric use guidelines for this population
- Assess febrile neutropenia protocols for treatment of catheter related bloodstream infections
- Reduce Length of Therapy/De-escalation Interventions
- MRSA nasal PCR swabs for pneumonia indication
- Education regarding time to positive blood culture in overall hospital population and specifically in this population
- Require indication upon order entry for easy targeted audit and feedback intervention
- 48-72 hour vancomycin timeout protocol
Suggestions for Ongoing Monitoring:
For ongoing monitoring of this scenario, continue to track SAAR values on the TAS reports (described in Figure 2) as these are the easiest way to trend recent data. An alternative is to use the SAAR Plot functionality described in Figure 1.
Post-education or intervention MUE may also be useful for this specific scenario as the focus is for a specific unit and population and specific data may be difficult to identify with high level data.