Example Scenario: During a pharmacy budget review, it was noted that aztreonam constituted a large portion of the pharmacy’s antibiotic budget. The hospital includes aztreonam on order sets for many common infections as an alternative for patients with severe beta-lactam allergies. However, there are more data to suggest that cephalosporins may be options for some patients with penicillin allergies.
The hospital pharmacy leadership asked the antibiotic stewardship program to identify potential areas of high use within the facility that can be targeted for education and determine whether or not certain clinical indications are driving use of this drug.
Background: The data captured in NHSN do not contain patient or prescriber-specific data. However, there are ways to leverage the data available in NHSN that allows the steward to narrow down and identify targeted patient populations for further investigation. NHSN data can also be useful when comparing utilization across different antibiotics or antibiotic classes. These tools will help identify interventions that specifically target areas of excess or unnecessary antibiotic use. When possible, these can also be combined with specific institutional data. In this scenario, we demonstrate how to use AU data to identify areas of high use of a high cost antimicrobial.
Manipulations of NHSN Extracts
Data Visualizations using NHSN AU Option Line Listing:
Figure 1. Rate Table by Location for Year Filtered by Aztreonam
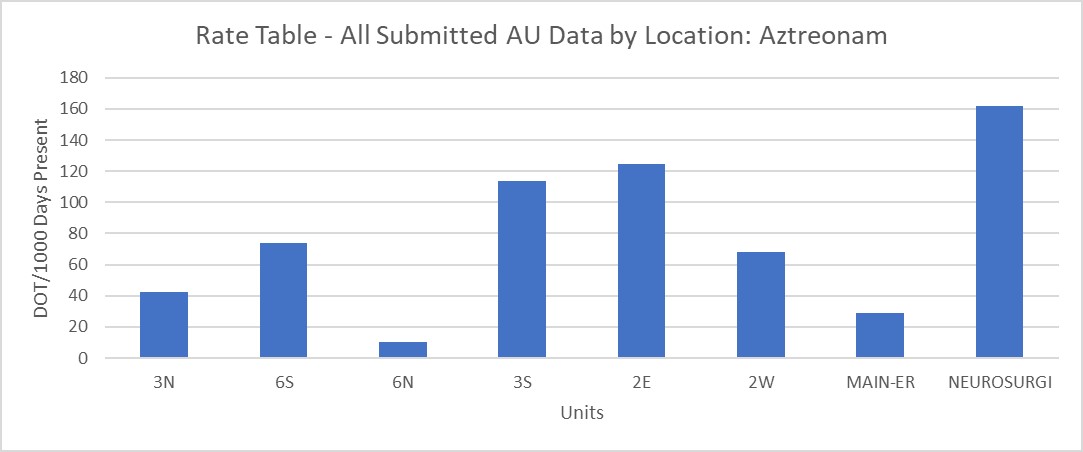
[Data Obtained From: NHSN-Analysis-Reports-Further information can be obtained in this CDC Quick Resource Guide- AU Rate Table-By Location]
What you will need for creating Figure 1:
- Access to NHSN Rate Table
Considerations for Interpretation: The Rate Table visualization gives a summary of antibiotic utilization which can be grouped by month, quarter, year, or cumulative since the onset of reporting at the unit level. For this case, this visualization helps narrow down which units have higher rates than others. Identifying specific units using NHSN data may assist in narrowing down a specific practice line or provider group with high initiation rates to target.
NHSN Line Listing by Location
Figure 2. Line Listing for High Use Unit by Month
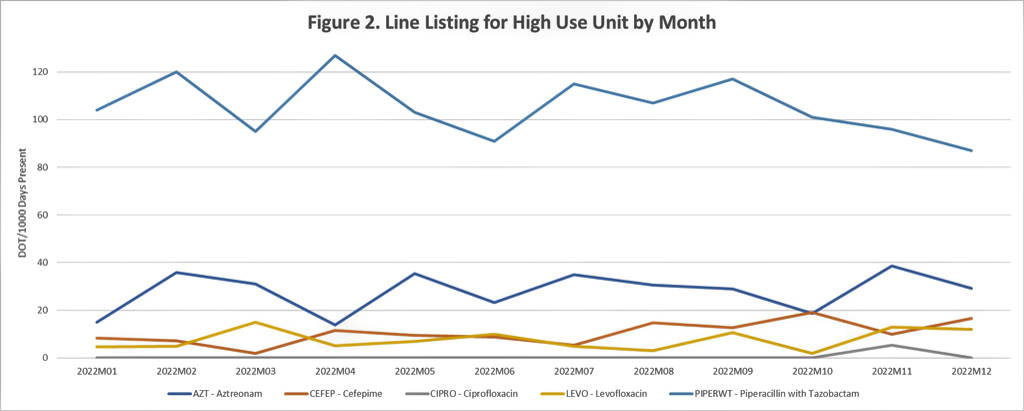
[Data Obtained From: NHSN-Analysis-Reports- Further information can be obtained in this CDC Quick Resource Guide AU Line List. This visualization was modified to select just the agents of interest as described in the quick resource guide]
What you will need for creating Figure 2:
- Access to NHSN Line Listing
Considerations for Interpretation: The Line Listing visualization in Figure 2 gives a summary of various antipseudomonal agents used at the hospital in the high-use Neurosurgical unit. For this case, the primary antipseudomonal agent for the unit is piperacillin-tazobactam and the utilization for cefepime is only slightly lower than utilization for aztreonam. This could suggest opportunities for allergy reconciliation and use of cefepime over aztreonam on this particular unit. This process can be repeated focusing on the other units with high aztreonam utilization in Figure 1 (3S and 2E).
Metrics Using Local Data Sources (Augmented Data)
When addressing high cost antimicrobials, site specific data, in addition to NHSN data, will be necessary to narrow down potential initiatives and areas where the largest cost savings will be achieved.
Figure 3. Aztreonam Days of Therapy (DOT) by Indication for High Utilization Unit (Neurosurgical)
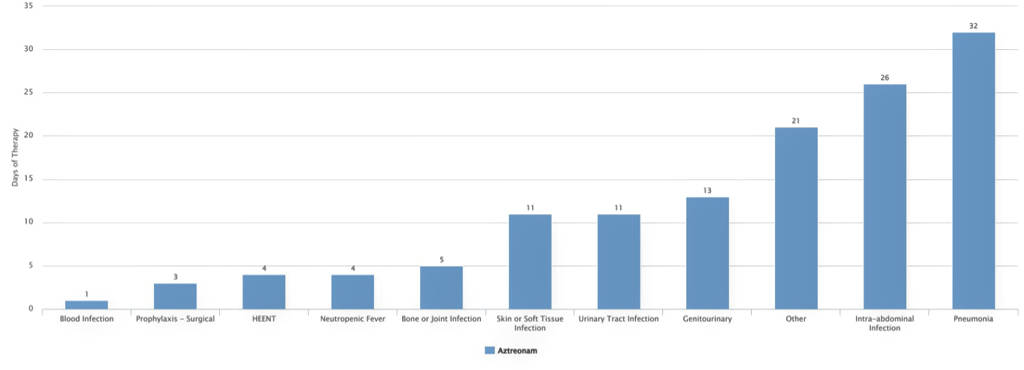
[Data Obtained From: Local Data Extracts- key considerations are discussed in this metric guide- Agent use by indication]
What you will need for these data visualizations:
- Antibiotic use by diagnostic code or indications
- Rates of penicillin allergy labels
Considerations for Interpretation: The data in this visualization is presented as raw DOT by indication. Combining the raw DOT by indication with previous NHSN information in Figures 1 & 2, a potential indication to target would be pneumonia in the neurosurgical unit. Further investigation into patient-specific data for this unit can confirm these patterns indicate high aztreonam use on the Neurosurgical Unit for pneumonia.
Figure 4. Penicillin Allergy Documentation in Aztreonam Orders
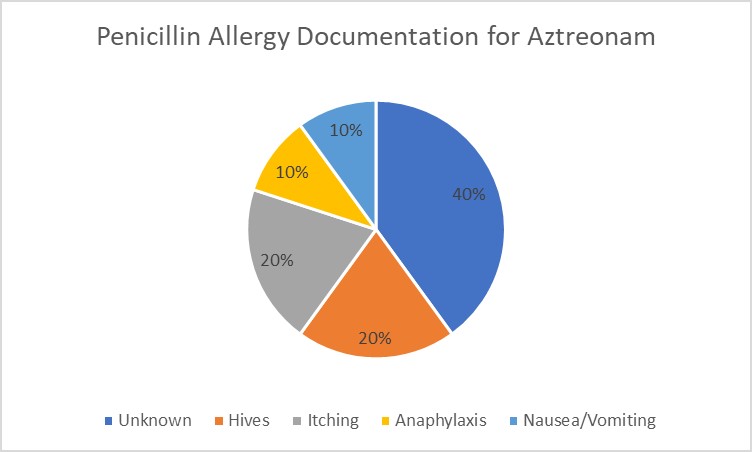
[Data Obtained From: Local Data Extracts of Allergy Documentation]
Considerations for Interpretation: This data visualization showcases the simple documentation of penicillin allergies in patients with aztreonam ordered. This data can be found using local data extracts, either through building IT reports or manual drug use evaluations. Based on this visualization, most of the penicillin allergies documented either need clarification or warrant the use of a cephalosporin or penicillin. Estimations in patients who could have received a penicillin or cephalosporin can contribute to estimations of cost savings. For this example, nausea/vomiting and itching are definitive allergies that could have used other antibiotics. The “unknowns” and “hives” likely need further clarification but also could contribute towards cost savings if able to switch to other antibiotics.
Menu of Stewardship Interventions:
To address the high rate of aztreonam use in this institution, there are several potential stewardship interventions based on the data the visualizations showcased.
- Proposal to C-suite for pharmacy student interns to assist with allergy assessments: This can be accomplished via a proposal that showcases that a cost savings would be achieved from the addition of interns.
- Practice Advisory for stewards to alert of penicillin allergy and recent penicillin receipt: To accomplish this intervention, IT will need to be heavily involved to determine the best alert for your institution’s electronic medical record. Alerts have the potential to be added if a patient has received a penicillin in the past and a person tries to enter the allergy on a patient’s chart or if there is a specific reconciliation note that states the patient tolerates penicillin.
- Update order sets to limit inclusion of aztreonam: Updating order sets to include an option for less severe allergies and the use of cephalosporins may provide an avenue to avoid aztreonam at order entry.
- Targeted audit and feedback: Having pharmacists provide targeted audit and feedback at 72 hours or upon being alerted by an alerting system (i.e. patient on aztreonam and has penicillin allergy) can have significant effects in the short term with reductions in antibiotic use.
- Removing cross-sensitivity alerts: To accomplish this intervention, IT will need to be heavily involved in determining if this is possible with your electronic medical record. Removing the cross-sensitivity alert for low risk situations may nudge providers towards using cephalosporins instead of aztreonam at order entry.
Many additional resources exist to assist programs with penicillin allergy assessments. These are nicely reviewed in this article:
Staicu M, Jeffres MN, Jones BM et al. Penicillin-allergy delabeling resources for clinicians practicing in resource-limited settings: a full educational review of the grey literature. JAC Antimicrob Resist 2023;5. https://www.ncbi.nlm.nih.gov/pmc/articles/PMC10026071/
Additional Resources:
PEN-FAST Risk Calculator
Carolina Antimicrobial Stewardship Program Penicillin Allergy Assessment Toolkit
Suggestions for Ongoing Monitoring:
For ongoing monitoring of this scenario, aztreonam utilization may continue to be tracked using the rate tables or the line listing (Figures 1 & 2).
Post-education or intervention MUE may also be useful for this scenario to determine if allergy reconciliation and recommendations are being interpreted correctly and accepted.