Example Scenario: In the past year, there was a recent update to the surgical site infection prophylaxis recommendations that placed a strong emphasis on not administering antibiotics post-operatively. It is commonly known that at your institution post-operative antibiotics are often started and continued.
In an effort to align your institution with the most current recommendations, the antimicrobial stewardship team has decided to target select practices and providers that are more likely to continue post-operative antibiotics compared to others, along with provide broad education about the updates.
Background: The data captured in NHSN do not contain patient or prescriber-specific data. However, there are ways to narrow down and identify which provider groups may be of particular use or which patient specific data to observe more closely. In this scenario, we demonstrate how to use AU data to identify highly variable practice patterns seen depending on specifics of case and surgeon.
Manipulations of NHSN Extracts
TAS Report – Adult SAAR Types – Locations Output
Figure 1. TAS Report – Adult SAAR Types – Locations
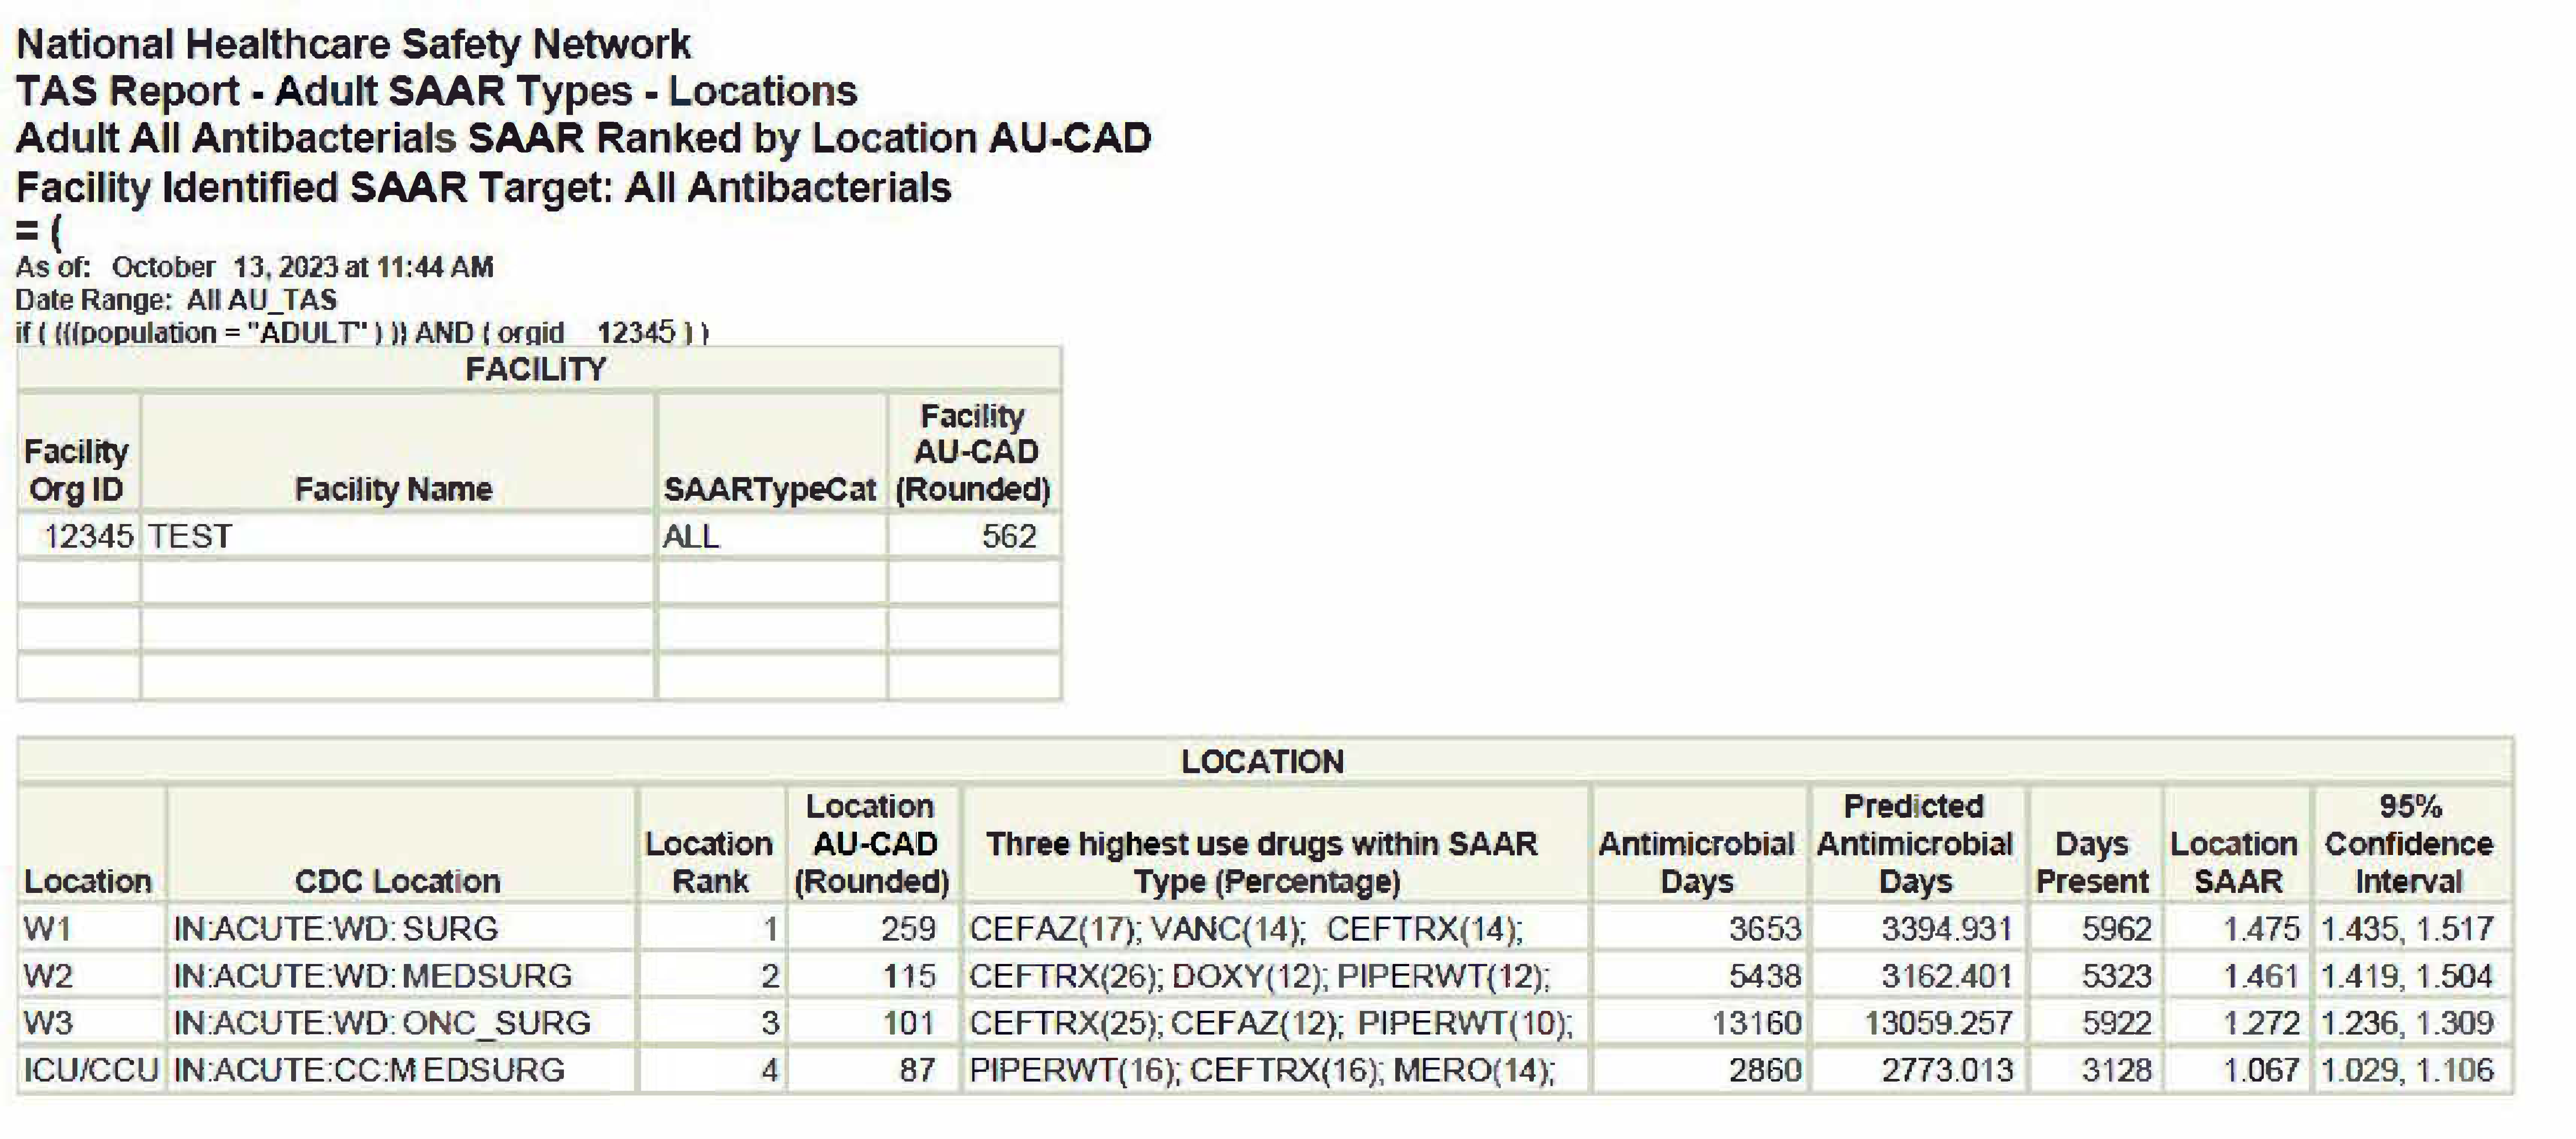
[Data Obtained From: NHSN-Analysis-Reports-Antimicrobial Use and Resistance Module- TAS Report- Adult SAAR Types-Locations A SAAR Target of 1 was entered on the TAS Dashboard for the adult population prior to generating this dataset]
What you will need for this data visualization:
- Access to TAS reports in the analysis tab of NHSN
Considerations for Interpretation: The data represented in the TAS Report above addresses two key points that will be useful for the antimicrobial stewardship intervention being pursued. The unit with the highest AU-CAD in the hospital is the SURG unit, meaning it has the highest number of antimicrobial days needed to achieve a targeted SAAR (which in this case is 1). There are two units that have CEFAZ as a high use drug within all SAAR categories, SURG and ONC_SURG. These two points together determine that this intervention will align your institution with current recommendations and will also have an impact on an area of the institution with an elevated SAAR.
Line Listing for cefazolin on selected units with high utilization
For this report, you will use data from the “Line Listing – All Submitted AU Data by Location” from the analysis tab in NHSN. Line listings may be downloaded as an .xls for further manipulation of data or to combine data and make comparative graphs. Figures 2 and 3 show similar data that can be obtained from NHSN in two different ways. Figure 2 uses the line listing of all submitted AU data for FACWIDEIN with filters applied to select the SURG unit and the drug cefazolin. Figure 3 uses the line listing for all submitted AU data by location filtered to the other high cefazolin use unit ONC_SURG.
Figure 2. Line Listing- All Submitted AU Data FACWIDEIN In Filtered by Cefazolin for High Use Unit (SURG)
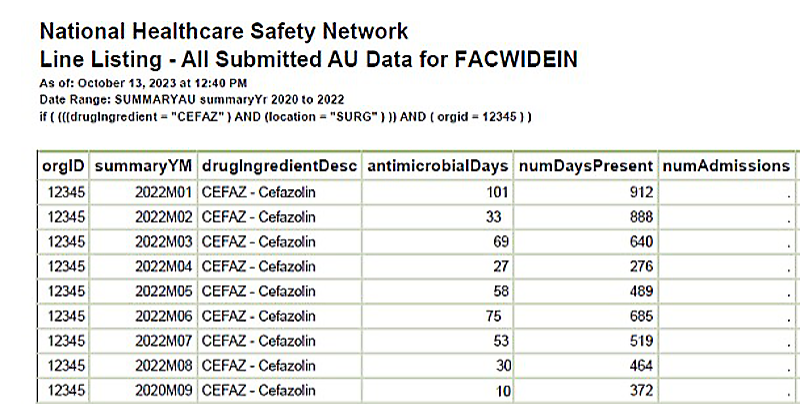
[Data Obtained From: NHSN-Analysis-Reports-Antimicrobial Use and Resistance Module- Line Listing-All Submitted AU Data for FACWIDEIN modified to filter for drugingredient = CEFAZ and location = SURG]
Figure 3. Line Listing- All Submitted AU Data by Location Filtered by Cefazolin for High Use Unit (ONC_SURG)
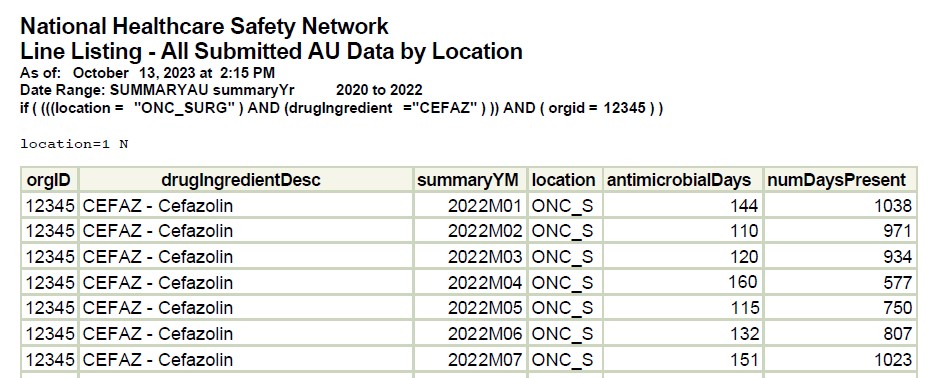
[Data Obtained From: NHSN-Analysis-Reports-Antimicrobial Use and Resistance Module- Line Listing-All Submitted AU Data for by location modified to filter for location = ONC_SURG and drugingredient = CEFAZ]
What you will need for this data visualization:
- Access to AU reports in the analysis tab of NHSN
Considerations for Interpretation: The simplest data manipulation is to determine the DOT/1,000 days present for cefazolin for each month to allow you to track normalized antibiotic use data. This is a simple calculation as described in this metric guide Antimicrobial-specific DOT per 1000 days present.
The data from the line listing will also be needed to allow for combination with site specific data to determine average length of therapy for cefazolin on a specific unit. This is described in the next section that demonstrates how to use NHSN data combined with local data extracts.
Metrics Using Local Data Sources (Augmented Data)
Data Visualizations Combining Data Extracts from NHSN with local Data on Procedure Date and Number of Patients Receiving Antimicrobials of Interest
Figure 4. Line Listing- All Submitted AU Data by Location with non-NHSN Admission Data Added
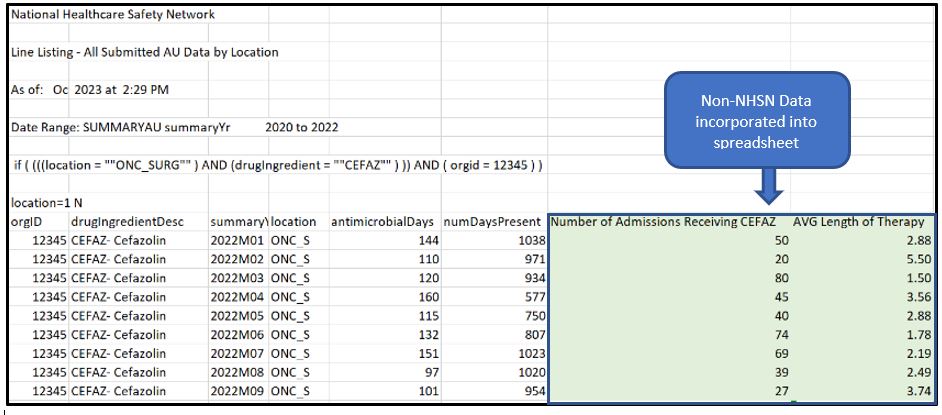
Figure 5. Comparison of Antimicrobial Specific Admission Data for High Utilization Units
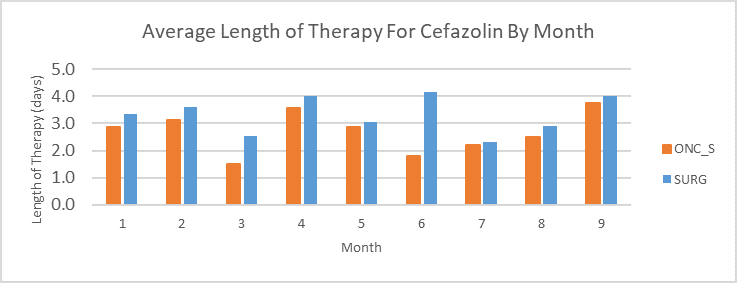
[Data Obtained From: Local Data Extracts- key considerations are discussed in this metric guide: Antimicrobial-specific Average Length of Therapy]
What you will need for this data visualization:
- Admissions per month receiving antimicrobial of interest
- NHSN Line Listing Data
Considerations for Interpretation: Based on the length of therapy determined with NHSN and non-NHSN data, the unit to focus antimicrobial efforts on is SURG as it has the higher length of therapy for cefazolin for most months compared to ONC_SURG, additionally, it had the highest AU-CAD in the hospital with cefazolin as the highest utilization.
Figure 6. Post-procedure Cefazolin Duration by Procedure Type on Specific Unit
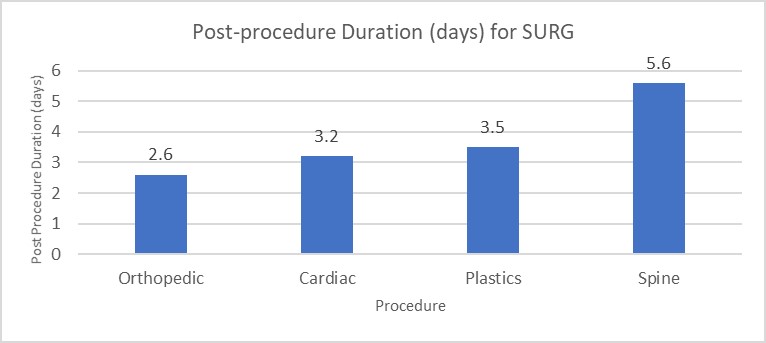
[Data Obtained From: Local Data Extracts- key considerations are discussed in this metric guide: Durations based on date of event]
What you will need for this data visualization:
- A list of procedure dates for targeted surgical procedures (this MAY be obtained from NHSN for certain procedures)
- NHSN Line Listing Data
Considerations for Interpretation: Using procedure data from your own institution or from manipulated NHSN data combined with your institution’s antibiotic use data extracted from NHSN (see Durations based on date of event) a comparison of cefazolin days of therapy post-procedure can be created. Based on these data, all surgery lines have durations that are above what is recommended. However, if looking to start with a particular group for education and discussion, surgeons within the spine center may be an appropriate start.
Menu of Stewardship Interventions:
To address the long length of therapy post-procedure within your institutions, there are several stewardship interventions.
- Investigate attending surgeon-specific practices and outcomes. Potential areas to investigate include how post-procedure orders are placed (such as a singular order set or various order sets depending on the service) and stop-dates on antibiotic orders at time or order entry
- MUE/syndrome Use Evaluation to identify common rationales for prolonged prophylaxis and use as talking points among specialty surgeon groups
Suggestions for Ongoing Monitoring:
For ongoing monitoring of this scenario, continue to track utilization via TAS reports (described in Figure 1) and with Line Listing (described in Figures 2-3). A post intervention use evaluation may also be necessary to determine if interventions had an impact on utilization. Areas to collect data on would be the following:
- Post-op duration/Length of Therapy (LOT)
- Post-op duration/LOT by surgeon
- Description of rationales for outliers