Example Scenario: During an annual prescriber feedback session it was noted that for the hematology/oncology units at the institution, there was a SAAR that progressively increased over the course of the last three years, however, the other SAAR types did not see the same increase, in fact, it seems that the other SAAR types saw a decrease over the same time period.
During the feedback session the Heme/Onc providers were looking for opportunities to improve their antimicrobial prescribing and asked the ASP team to provide more details regarding this increase in their SAAR. Upon closer look, the utilization of antibiotics in that particular SAAR type was concentrated on a single unit that serves primarily surgical subspecialty patients in addition to hematology/oncology patients. In assessing this increase, you wish to address any potential prescribing differences from the institution’s guidelines.
Background: The data captured in NHSN has the ability to trend SAAR values for various SAAR types year over year and to narrow these SAARs to specific areas of the hospital. However, the data in NHSN do not contain patient or prescriber-specific data. For this specific scenario, the elevated SAAR value for one outlier hematology/oncology unit is being investigated. There are three units in the facility classified as hematology/oncology units. One unit primarily serves liquid tumors, the second primarily serves solid tumors. The third floor is the surgical oncology floor but it also serves surgical subspecialty patients. In this scenario, we demonstrate how to use AU data to identify prescriber groups and guideline adherence for potential stewardship interventions.
Manipulations of NHSN Extracts
SAAR Plot - All Adult and Pediatric SAARs
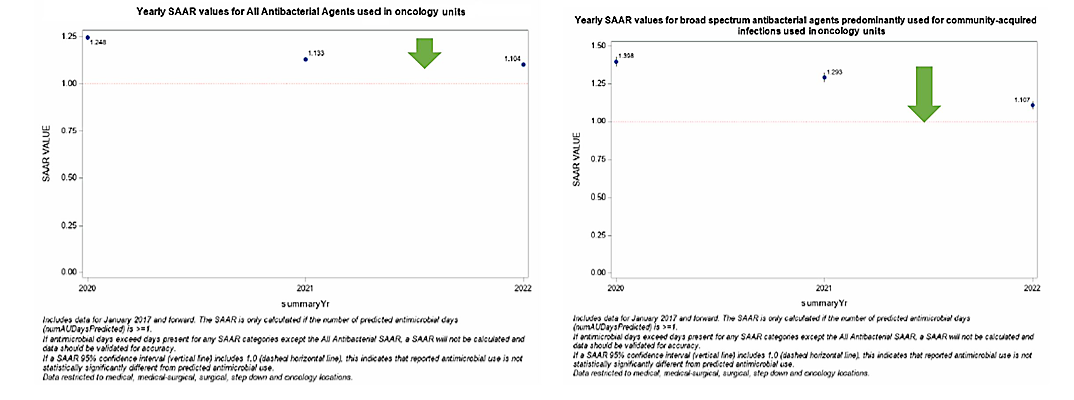
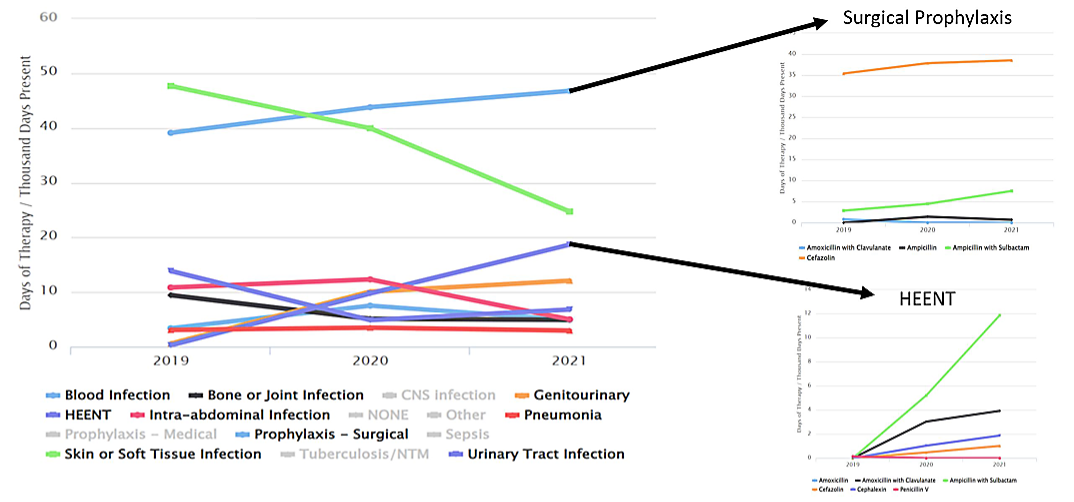
Figures 1 & 2. SAAR Plot for ONC Units from 2020 to 2022
Figures 3 & 4. SAAR Plot for ONC Units from 2020 to 2022
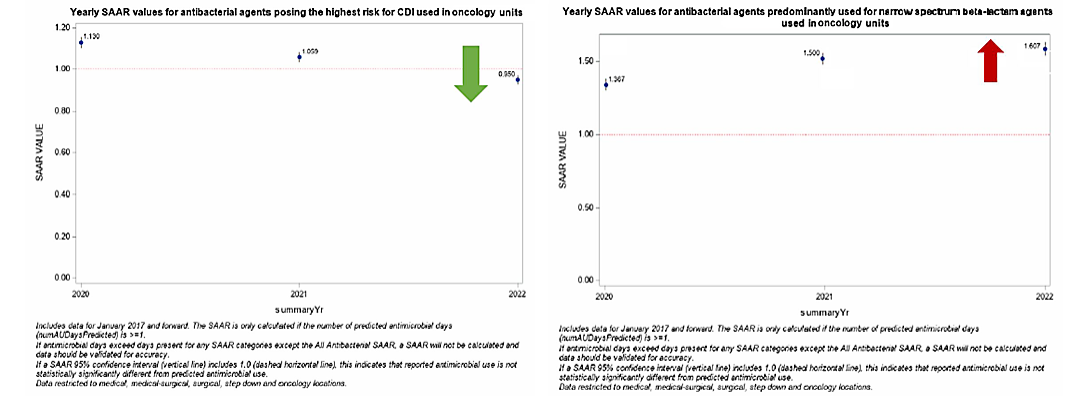
[Data Obtained From: NHSN-Analysis-Reports-Antimicrobial Use and Resistance Module SAAR Plot-All Adult and Pediatric SAARs]
What you will need for creating these data visualizations:
- Access to NHSN AU data in the Analysis tab in NHSN
For these figures, you will use the SAAR Plot – All Adult and Pediatric SAARs under the Antimicrobial Use and Resistance Module in the Analysis tab. These figures can be narrowed to specific units and specific SAAR types.
Figure 5. NHSN SAAR Data for ONC Units from 2020-2022 Utilizing Data Extracted to .XLS
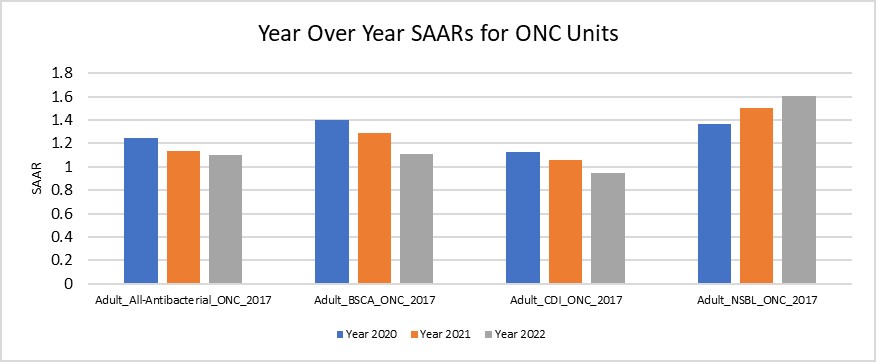
[Data Obtained From: NHSN-Analysis-Reports- SAAR Report All Adult and Ped SAARs that was exported into ExcelTM]
What you will need for creating this data visualization:
- Access to NHSN AU data in the Analysis tab in NHSN
- Access to Excel™ or other spreadsheet software
Considerations for Interpretation: The NHSN SAAR output gives a quick summary of the SAAR types for the hematology/oncology units within the institution. Yearly trends can be identified within SAAR types via these plots which can assist in narrowing down units/antibiotics to look into further (e.g. here Adult NSBL on the hematology/oncology units was noted to have the increase over the last three years). The data utilized to create figures 1-4 can also be exported to .XLS and manipulated to be combined into one succinct figure (see figure 5).
TAS Report - Adult SAAR Types - Locations Output
Figure 6. TAS Report-Adult SAAR Types- Locations Exported to .XLS

[Data Obtained From: NHSN-Analysis-Reports- TAS Report Adult SAAR Types-Locations. More detailed instructions on TAS Reports can be found in the Keys to Success with TAS CDC Guide.]
What you will need for creating this data visualization:
- Access to NHSN AU data in the Analysis tab in NHSN
Considerations for Interpretation: In this figure, the data exported from NHSN gives a quick summary of the hematology/oncology floors and their ranks in the SAAR Type NSBLs. Based on these data, 1ONC unit is ranked the highest for location AU-CAD (155) compared to the two other units (20 and 5). With the TAS Reports, it is easy to see that antibiotics of highest utilization in this specific SAAR Type category for the 1ONC floor are cefazolin, amoxicillin/clavulanate, and ampicillin/sulbactam.
Line Listing - All Submitted AU Data - By Location
Figure 7. Line Listing – All Submitted AU Data by Location – Filtered by High Use Antibiotics and High Use Unit
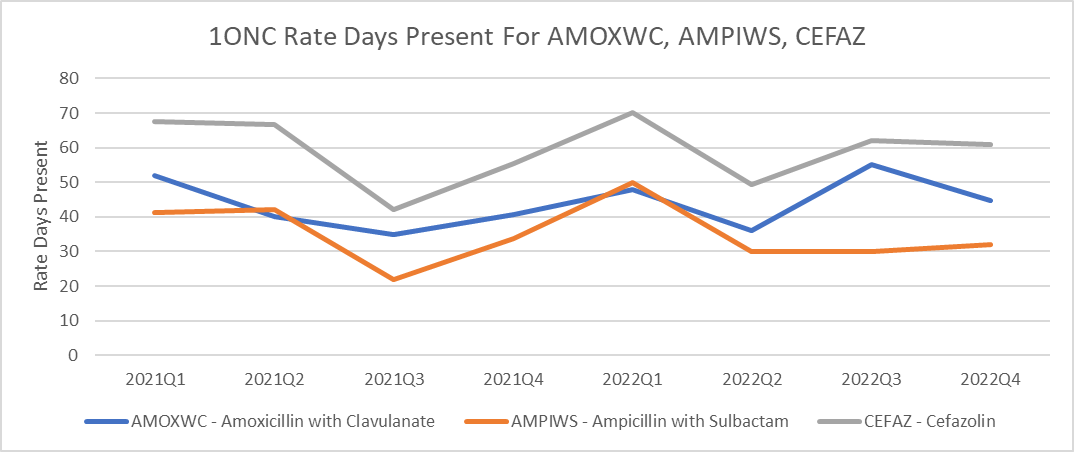
[Data Obtained From: NHSN-Analysis-Reports-Antimicrobial Use and Resistance Module Line Listing – All Submitted AU Data by Location- More information on how to perform these manipulations can be found in this metric guide: Antimicrobial specific DOT per 1000 days present]
What you will need for creating this data visualization:
- Access to NHSN AU data in the Analysis tab in NHSN
- Access to Excel™ or other spreadsheet software
Considerations for Interpretation: In this figure, the data exported from NHSN was compiled to depict the days of therapy/1000 days present for the antibiotics identified in the TAS Report from Figure 6. The rates are separated by drug ingredient and focused specifically on the 1ONC unit. Knowing that this unit primarily serves surgical subspecialty patients, it is very likely that much antibiotic use is related to surgical prophylaxis. Being able to provide specific data to the prescribers working on this unit about the antibiotics that are causing the SAAR to increase allowed more meaningful discussion. At a follow-up meeting the prescribers felt that this change likely reflected a change in surgical prophylaxis to a more narrow regimen in targeted surgical oncology patients. This intervention included a shorter duration of prophylaxis as well which is why an overall decrease in use as well as a shift in which agents are used is observed in the data.
Metrics Using Local Data Sources (Augmented Data)
Optional Augmented Data to Inform Stewardship Work:
Not all facilities will be able to narrow down antimicrobial use to a specific group of providers (such as what we were capable of doing with this example). In some cases, with additional information technology support, data on specific indications, prescribers, and durations can be obtained.
Figure 8. Narrow Spectrum Beta-lactams by Indication on 1ONC Floor
[Data Obtained From: Local Data Extracts- key considerations are discussed in this metric guide: Agent Use by Indication]
What you will need for this data visualization:
- Indications Information
- Access to local antimicrobial prescribing data that includes administrations or orders with indication listed (if available)
- Access to Excel™ or other spreadsheet software.
Figure 9. Duration of Therapy/Targeted Antimicrobial Use Admissions for Ampicillin/sulbactam
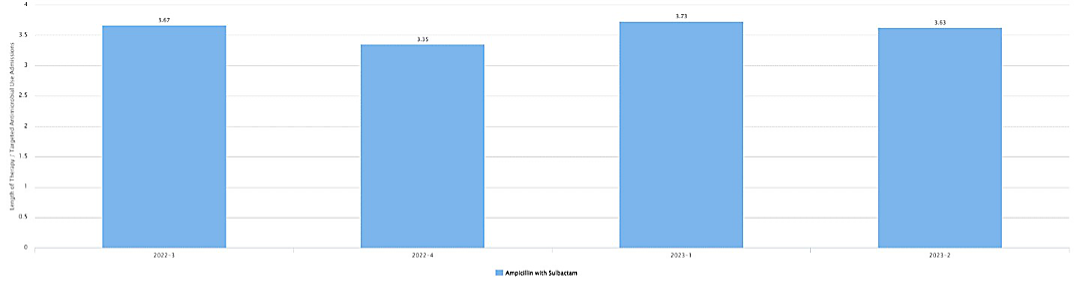
[Data Obtained From: Local Data Extracts- key considerations are discussed in this metric guide: Targeted admissions denominator]
What you will need for this data visualization:
- Duration of Therapy
- Access to local antimicrobial prescribing data that includes administrations or orders
- Access to Excel™ or other spreadsheet software.
Considerations for Interpretation: In figures 8 & 9, the visualization shows the antimicrobial use by indication and then duration of therapy for targeted admissions. Taking in the increase in ampicillin-sulbactam days of therapy/1000 patient-days with a consistent duration of therapy on the unit suggests that empiric therapy is the best area to target to reduced days of therapy. Based on the TAS Report above, the number of days to reduce antibiotics in 1ONC for NSBL to target a SAAR of 1 is 155 over 12 months.
Menu of Stewardship Interventions:
To address the increasing NSBL SAAR in the hematology/oncology unit, there are several potential stewardship interventions. Interventions could be focused on empiric initiation of ampicillin/sulbactam, such as following surgical prophylaxis guidelines and with clean procedures not initiating prophylaxis. Other potential interventions are listed below:
- Focused review of ENT surgery cases with focus on post-op duration.
- Develop risk stratification and criteria for post-operative duration decisions with ENT surgery. Complex cases – ID consult.
- Discuss with Infection Prevention whether re-mapping surgical oncology unit to surgery rather than hematology/oncology would provide more meaningful data. Based on the preceding data, this may be a better area for the antibiotics utilization to be categorized in.
- Following review, you may note that the change actually reflects adherence to the new prophylaxis guideline and no further stewardship intervention is needed.
Suggestions for Ongoing Monitoring:
For ongoing monitoring of this scenario, continue to track the SAAR values on the TAS reports as described above. This will be the easiest way to monitor utilization changes for specific units or floors. In addition, days of therapy/1000 patient-days for specific agents on specific floors, also described above, may be an alternative to monitoring.
An approach such as that outlined here can be helpful in meeting the new 2023 Joint Commission Standards for antimicrobial stewardship. These include the requirement for the stewardship program to evaluate adherence to at least one evidence-based hospital guideline.