Example Scenario: The Quality Committee monitors adverse events and has noted an increase in C. difficile infection (CDI) in patients who have received fluoroquinolones and would like for the stewardship team to investigate whether or not patients who receive these agents are at increased risk of developing CDI.
The stewardship team is able to track fluoroquinolone prescribing trends and identify which units prescribe these agents more frequently using NHSN data. Using local data, the team decides to drill down to determine how often fluoroquinolones are prescribed empirically to all admitted patients and to patients with a diagnosis of CDI. In addition to looking at fluoroquinolone average durations, the team decides to determine the percentage of admissions who develop CDI within 30 days of receiving fluoroquinolone and their day of CDI onset.
Background: The data captured in NHSN includes information on antimicrobial use, broken down by drug class and individual agent, and C. difficile event data. However, the antibiotic use data in NHSN do not contain patient or prescriber-specific data. For this specific scenario, we demonstrate how to use AU data to identify areas of high use for a certain antimicrobial class and apply this to augmented data and describe prescribing trends with a specific adverse event.
Manipulations of NHSN Extracts
NHSN TAS Report Adult SAAR Types - Locations Output
Figure 1. TAS Report by Location
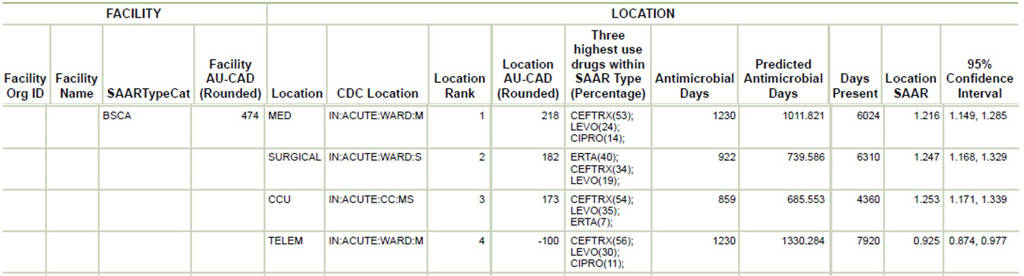
[Data Obtained From: NHSN-Analysis-Reports-Antimicrobial Use and Resistance Module- TAS report Adult SAAR Types- Locations TAS Report]
What you will need for this data visualization:
- Access to NHSN AU data in the Analysis tab in NHSN and the Targeted Assessment for Stewardship (TAS) reports to identify areas of high use for the SAAR category broad spectrum antibacterial agents predominantly used for community-acquired infections (BSCA)
Considerations for Interpretation: A TAS Report may be run to determine the top agents in specific SAAR categories in specific locations throughout the institution. For this example, the focus is fluoroquinolones. Based on the above visualization, levofloxacin is the second highest BSCA agent on the ward called telemetry (classified in NHSN as a medical ward), medical wards, and critical care units. Given the medical wards have the highest AU-CAD, this may be a good location to focus stewardship efforts.
NHSN Rate Table - Selected Drugs - By Location
Figure 2. Rate Table by Location
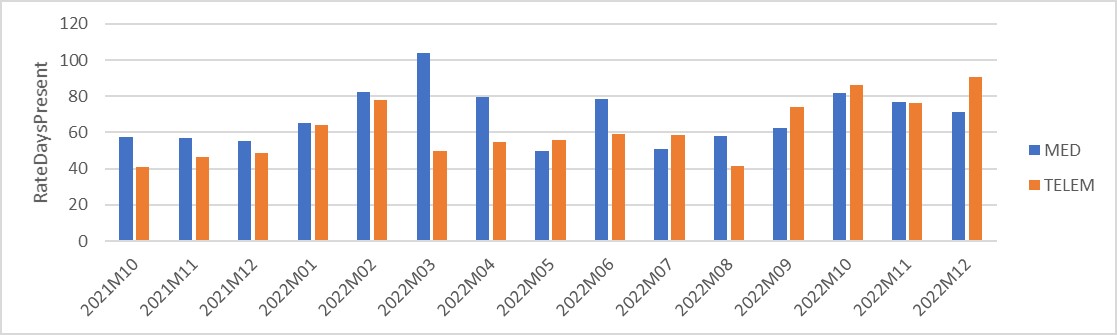
[Data Obtained From: NHSN-Analysis-Reports-Antimicrobial Use and Resistance Module- Rate Table- Selected Drugs - Antimicrobial Utilization Rates by Location extracted and manipulated in ExcelTM]
What you will need for this data visualization:
- Access to NHSN AU data in the Analysis tab in NHSN and the Rate Table reports
For this figure, you will use Rate Table All Submitted AU Data- Antimicrobial Utilization Rates by Location in the Analysis tab. These data can be filtered to only supply a specific drug class for units in order to narrow the focus. Once filtered, these data can be exported to .XLS and within .XLS they can be manipulated to analyze specific units and dates. More information on how to manipulate the rate tables can be found in this CDC quick reference guide: Antimicrobial Use Rate Table- By Location
Considerations for Interpretation: A Rate Table Report may be run to confirm units with highest fluoroquinolone utilization. For this example, fluoroquinolone utilization in RateDaysPresent continues to be higher on the MED ward compared to the TELEM ward. This confirms that the focus should narrow to these specific wards. Utilizing the NHSN C. difficile event data to determine months where cases were identified will be key while using augmented data to identify if patients received fluoroquinolones prior to the events.
Metrics Using Local Data Sources (Augmented Data):
Not all facilities will be able to narrow down antimicrobial use to a specific event or to specific admissions (such as what we were capable of doing with this example). In some cases, with additional information technology support, data on specific indications, prescribers, and durations can be obtained. In addition, the adverse event in this scenario is CDI because of the availability of the adverse event of interest within NHSN. If patient-specific data are available, the same processes outlined below could be followed to assess any adverse event of interest such as acute kidney injury, rash, infusion related reactions, etc as long as diagnostic code data are available.
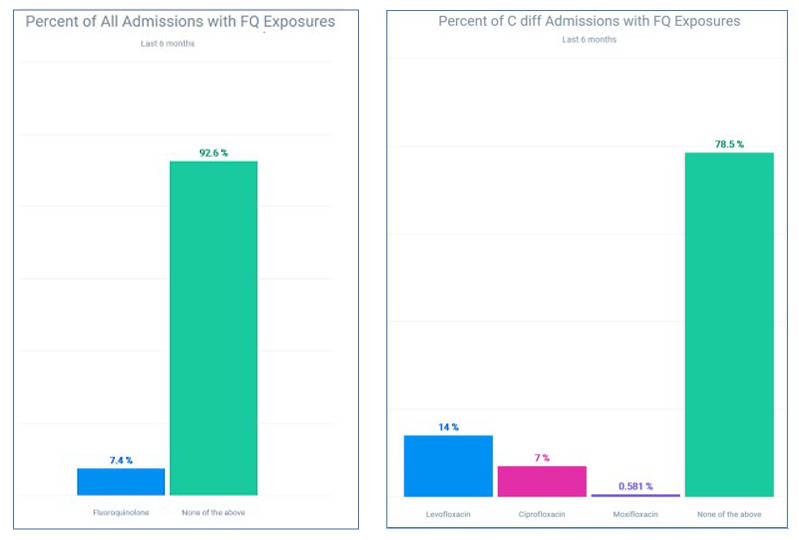
Figures 3 & 4. Fluoroquinolone Use by All Admissions and C. difficile Admissions
[Data Obtained From: Local Data Extracts- key considerations are discussed in this metric guide: Percent of Patient Admissions receiving a Specific Antimicrobial]
What you will need for this data visualization:
Antimicrobial use by patient admissions data
- Access to local antimicrobial prescribing data
- Access to local patient admissions or encounters data with diagnosis codes
- Access to Excel™ or other spreadsheet software
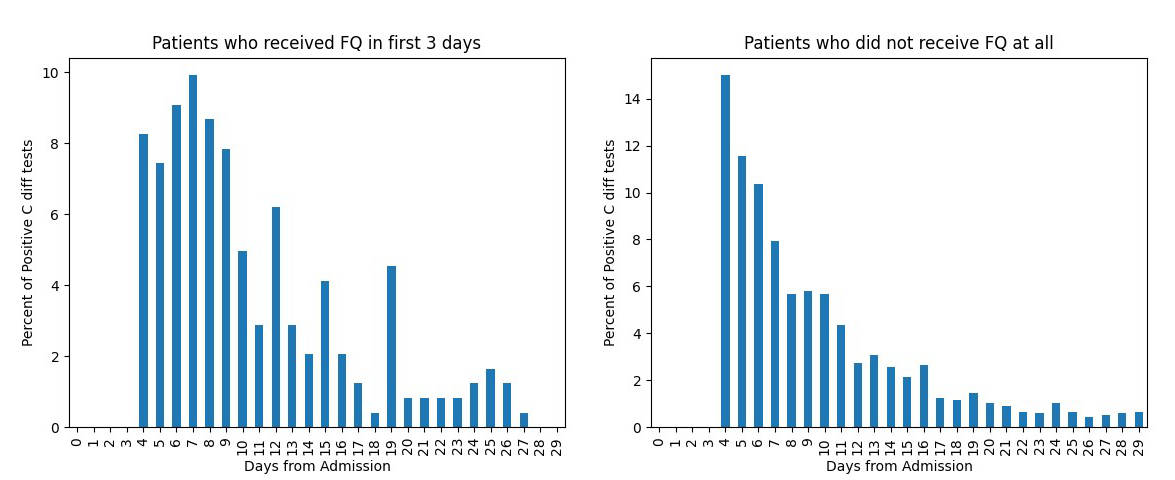
Figures 5 & 6. C. difficile Positivity by Day of Admission in Patients with and without fluoroquinolone exposure
[Data Obtained From: Local Data Extracts- key considerations are discussed in this metric guide: Durations based on date of event]
What you will need for this data visualization:
Durations based on date of event
- Access to local antimicrobial prescribing data that includes administrations
- Access to local patient admissions or encounters data with diagnosis codes
- Access to lab data with C. difficile testing information (such as testing and results)
- Access to Excel™ or other spreadsheet software
Considerations for Interpretation: In figures 3-6, the visualizations breakdown several ways of utilizing local data to determine if patients on fluoroquinolones are at an increased risk for CDI. Figures 3 and 4 showcase the number of total admissions with fluoroquinolone exposure and then takes it a step further by utilizing the specific admissions related to CDI, this showcases that 20% of CDI-related admissions also have fluoroquinolone exposure.
In figures 5-6, in patients with CDI who received fluoroquinolones early in their admission compared to patients who did not receive fluoroquinolones at all, CDI cases tend to be clustered near the onset of admission. This showcases that targeting early fluoroquinolone use may be the most appropriate intervention on the units of high-utilization determined with NHSN data.
Menu of Stewardship Interventions:
To address the increase in CDI for patients receiving fluoroquinolones, based on the visualizations showcased, interventions should be focused on targeting early fluoroquinolone use. Interventions could be focused on empiric initiation of fluoroquinolones using guidelines or education or could involve targeted interventions for specific fluoroquinolones (in this case levofloxacin) by determining appropriate indications via order entry.
Suggestions for Ongoing Monitoring:
For ongoing monitoring of this scenario, continuing to track infection rates using NHSN reporting data along with monthly antimicrobial use from the NHSN AU data will be the easiest way to monitor improvements. Figure 7 below showcases an example of combining this data. Another way to continue to monitor, specifically for this intervention of targeting early fluoroquinolone use, patient admission and fluoroquinolone use data can continue to be followed for decreases in percent of patient admissions receiving fluoroquinolones (Figure 8).
Figure 7. Fluoroquinolone Use and CDI Rate
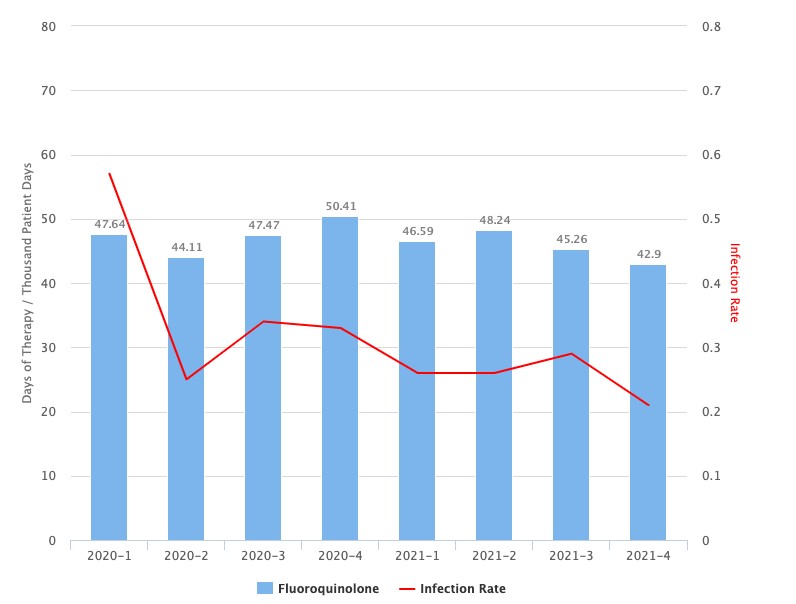
[Data obtained from NHSN Extracts with local manipulation. Key considerations are discussed in this metric guide: NHSN Infection Rate Extracted to Combine with Antibiotic Data]
Figure 8. Fluoroquinolone Use by All Admissions
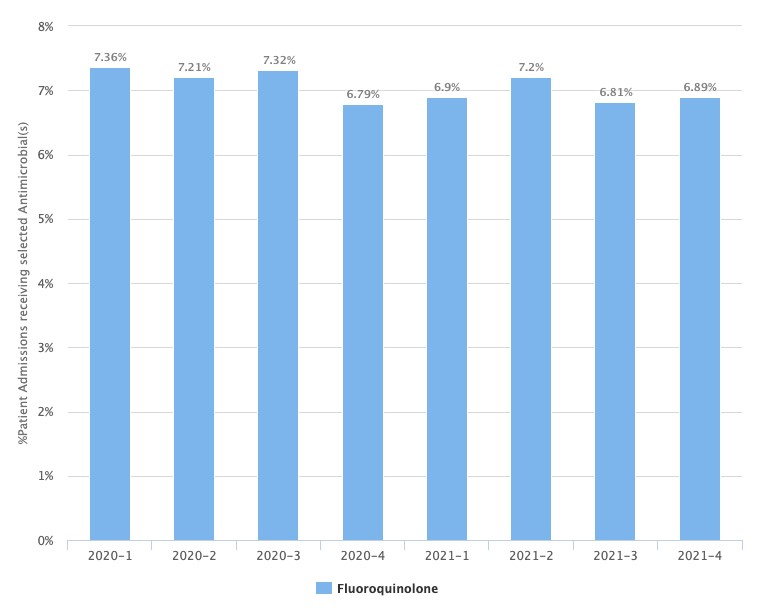
[Data Obtained From: Local Data Extracts- key considerations are discussed in this metric guide: Percent of Patient Admissions receiving a Specific Antimicrobial]