Example Scenario: Your hospital has just begun submitting data into NHSN and you are eager to begin using the data to inform stewardship work at your facility.
Background: The NHSN AU Option has several reports as part of the Targeted Assessment for Antimicrobial Stewardship (TAS) Strategy that aid facilities in doing initial assessments of antimicrobial use data. This is an excellent place to help identify initial areas for further assessment. Once a target is identified, such as high use of a particular SAAR category, stewards can navigate the NHSN data to better identify targets for a stewardship intervention. Often high use of an SAAR category can be pinpointed to a specific hospital location. Knowing this allows stewards to design specific stewardship interventions that can rapidly address the problem at the specific source.
Manipulations of NHSN Extracts
Data Visualizations using NHSN AU Option TAS Report- Facility Level
What you will need for creating this data visualization:
- Access to NHSN AU data in the Analysis tab in NHSN
For this table, you will use data extracted using the “TAS Report-Facility Level” from the Analysis Tab in NHSN. This report can be modified to just export data on the time period of interest. More detailed instructions on how to manipulate this report within NHSN can be found in the CDC quick reference guide TAS Report-Facility-Level.
Table 1. TAS Report for Adult Units
| Facility Name |
SAAR TypeCat |
AU-CAD Rank |
Facility AU-CAD (Rounded) |
Three highest use drugs within SAAR Type (Percentage) |
Antimicrobial Days |
Predicted Antimicrobial Days |
Days Present |
Location SAAR |
95% Confidence Interval |
|---|---|---|---|---|---|---|---|---|---|
| CDA TEST FACILITY- DUKE |
ANTIFGL | 1 | 132 | FLUCO(84); ANID(9); MICA(7); |
319 | 188.800 | 8456 | 1.696 | 1.286, 2.131 |
| BSCA | 2 | 149 | CEFTRX(67); LEVO(15); CIPRO(11); |
1313 | 1164.188 | 8456 | 1.128 | 1.068, 1.190 | |
| CDI | 3 | 116 | CEFTRX(47); CEFEP(27); LEVO(11); |
1861 | 1744.715 | 8456 | 1.067 | 1.019, 1.116 | |
| ALL | 4 | 86 | CEFTRX(17); VANC(15); PIPERWT(11); |
5293 | 5206.901 | 8456 | 1.017 | 0.989, 1.044 | |
| GRAMPOS | 5 | -36 | VANC(88); LNZ(7); DAPTO(5); |
795 | 830.894 | 8456 | 0.957 | 0.892, 1.025 | |
| BSHO | 6 | -40 | PIPERWT(45); CEFEP(39); MERO(13); |
1285 | 1325.167 | 8456 | 0.970 | 0.918, 1.024 | |
| NSBL | -40 | CEFAZ(60); AMOXWC(13); AMPIWS(12); |
709 | 748.756 | 8456 | 0.947 | 0.879, 1.019 |
[Data Obtained From: NHSN-Analysis-Reports-Antimicrobial Use and Resistance Module- Targeted Assessment for Stewardship (TAS) Reports- TAS Report-Adult SAAR Types-Facility (modified to export as PDF and desired SAAR set at 1 for all drug categories).]
Considerations for Interpretation: The TAS report at the facility level provides insight into the antimicrobial categories that have the highest SAARs and also the individual agents within each SAAR category that is contributing to that SAAR. From what you see above, the antifungal drug category has the highest SAAR for adult locations at this facility. This makes antifungal agents an ideal target for a stewardship intervention.
Data Visualizations using NHSN AU Option TAS Report- By Location
Using a similar process, data can be exported that shows which unit has the highest SAAR for each SAAR category. Instructions on how to modify this report can be found in the CDC Quick Reference Guide: TAS Report- Location-level.
What you will need for data visualization for Table 2:
- Access to NHSN AU data in the Analysis tab in NHSN
Table 2. TAS Report by SAAR Type and Hospital Location
| FACILITY | LOCATION GROUP | |||||||||||
|---|---|---|---|---|---|---|---|---|---|---|---|---|
| Facility Name |
SAAR TypeCat |
Facility AU-CAD (Rounded) |
Location | CDC Location | Location Rank |
Location AU-CAD (Rounded) |
Three highest use drugs within SAAR Type (Percentage) |
Antimicrobial Days |
Predicted Antimicrobial Days |
Days Present |
Location SAAR |
95% Confidence Interval |
| ICU | IN:ACUTE:CC:MS | 5 | -21 | CEFAZ(65); AMPIWS(30); AMOX(5); |
37 | 57.765 | 668 | 0.641 | 0.458, 0.874 | |||
| MED/SURG1 | IN:ACUTE:WARD:MS | 6 | -34 | AMOXWC(39); CEFAZ(28); AMPIWS(15); |
74 | 108.007 | 1249 | 0.685 | 0.542, 0.855 | |||
| HEM/ONC | IN:ACUTE:WARD: ONC_HONC |
7 | -35 | AMPIWS(47); CEFAZ(35); AMOX(18); |
17 | 51.590 | 984 | 0.330 | 0.198, 0.517 | |||
| ANTIFGL | 132 | ICU | IN:ACUTE:CC:MS | 1 | 52 | FLUCO(97); MICA(3); |
78 | 25.844 | 668 | 3.018 | 2.766, 3.591 | |
| MED/SURG2 | IN:ACUTE:WARD:MS | 2 | 26 | ANID(50); FLUCO(50); |
45 | 18.893 | 1219 | 2.381 | 1.501, 3.254 | |||
| SURG | IN:ACUTE:WARD:S | 26 | FLUCO(79); ANID(21); |
48 | 21.946 | 1416 | 2.187 | 1.537, 2.327 | ||||
| MED | IN:ACUTE:WARD:M | 3 | 20 | FLUCO(100); | 43 | 23.310 | 1504 | 1.845 | 1.439, 2.144 | |||
| MED/SURG1 | IN:ACUTE:WARD:MS | 4 | 4 | FLUCO(100); | 23 | 19.358 | 1249 | 1.188 | 0.927, 1.453 | |||
| STEPDOWN | IN:ACUTE:STEP | 5 | 2 | FLUCO(64); MICA(36); |
27 | 25.447 | 1416 | 1.061 | 0.927, 1.251 | |||
| HEM/ONC | IN:ACUTE:WARD: ONC_HONC |
6 | 2 | FLUCO(88); MICA(12); |
56 | 54.002 | 984 | 1.0369 | 0.828, 1.248 | |||
[Data Obtained From: NHSN-Analysis-Reports-Antimicrobial Use and Resistance Module- Targeted Assessment for Stewardship (TAS) Reports- TAS Report-Adult SAAR Types-Locations]
Considerations for Interpretation: The TAS report at the location level allows you to easily see which unit in the hospital is contributing to the overall facility-wide SAAR. In this example above, the ICU has the highest SAAR. In this case, the ICU also contributes the largest number of antifungal days for the facility, but please note that because the SAAR is a ratio, this is not always the case. In other words, a unit may have higher antifungal days, but a lower SAAR if they have a higher number of predicted antimicrobial days.
Potential Stewardship Interventions:
To address the high rate of antifungal drug use, there are some proven antifungal stewardship strategies that may be implemented.
- Does your facility have adequate diagnostics to guide antifungal therapy:
- Are non-culture based diagnostic tests (i.e. galactomannan)?
- Are there protocols in place that drive unnecessary antifungal agent use? If so, consider modifying or eliminating these protocols.
- Some examples of these include routine prophylaxis and empiric sepsis treatment protocols that include antifungal agents for all patients
- Is there a role for diagnostic stewardship? Unnecessary antifungal drug use has been noted in several scenarios common in the ICU including:
- Treatment of Candida colonization in the urine
- Treatment of Candida isolated in the sputum, which is often not true infection
- Review cases of antifungal use to see if treatment is appropriate per national or institutional guidelines
Resources:
Core Recommendations for Antifungal Stewardship: https://www.ncbi.nlm.nih.gov/pmc/articles/PMC7403757/
IDSA Antifungal Treatment Guidelines: https://www.idsociety.org/practice-guideline/practice-guidelines/#/+/0/date_na_dt/desc/
Suggestions for Ongoing Monitoring:
For ongoing monitoring of this scenario, it makes sense to track the SAAR data specific for the ICU. A quarterly interval should be adequate because particularly at the individual unit level, month to month variations may be difficult to interpret. There are two easy ways to do this right within NHSN.
What you will need for data visualization for Table 3 and Figure 1:
- Access to NHSN AU data in the Analysis tab in NHSN
Table 3: Antifungal SAARs for the Adult ICUs Displayed Quarterly
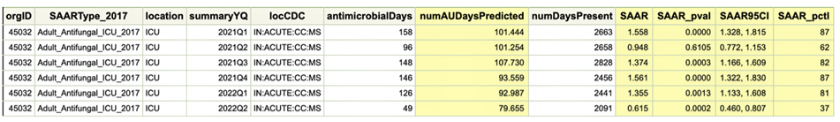
[Data Obtained From: NHSN-Analysis-Reports-Antimicrobial Use and Resistance Module- Antimicrobial Use Data-SAAR Report- All Adult and Ped SAARS by Location- modified under Display Options to select ‘summaryYQ’ and under Filters to add SAARType-2017 equal to Antifungal agents predominantly used for invasive candidiasis used in adult SAAR ICUs.].
Figure 1. SAAR Plot for Antifungal SAARs in the Adult ICUs Displayed Quarterly
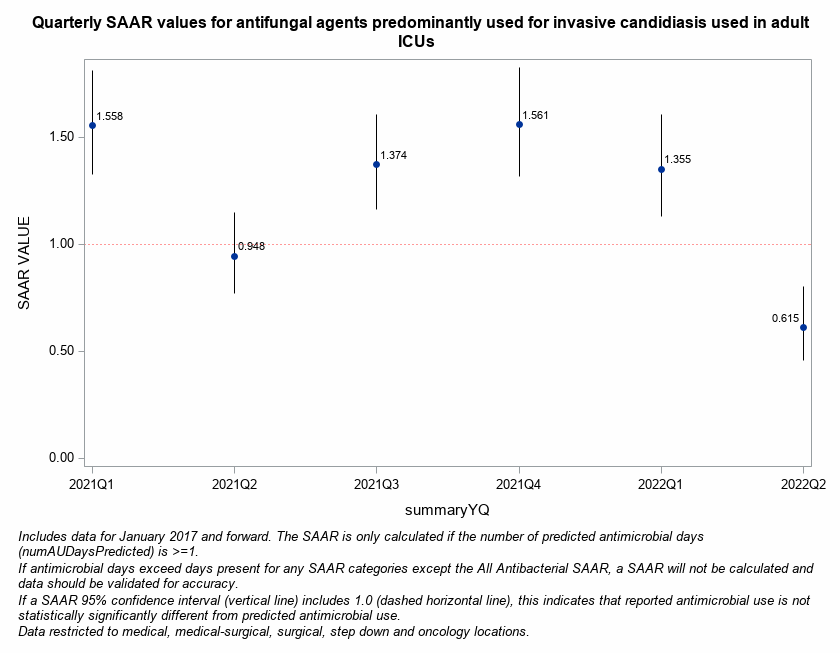
[Data Obtained From: NHSN-Analysis-Reports-Antimicrobial Use and Resistance Module- Antimicrobial Use Data-SAAR Plot- All Adult and Pediatric SAARS (2017 Baseline)- modified under Display Options to select ‘summaryYQ’ in the Group By drop down and under Filters to add SAARType-2017 equal to Antifungal agents predominantly used for invasive candidiasis used in adult SAAR ICUs.].